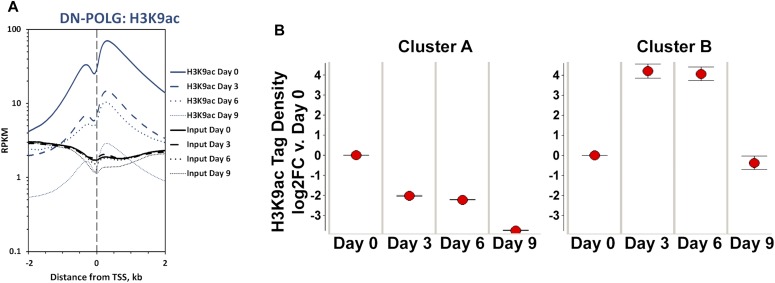
Figure 1. Changes in histone acetylation caused by progressive mtDNA depletion occur in specific loci and are robust already at day 3.
(A) Average genome-wide enrichment level of H3K9ac peaks DNA centered around the TSS of genes. N = 2 per time point. Blue line shows data for H3K9ac and black lines for input DNA. (B) Time-dependent patterns of average significantly different enriched H3K9ac peaks relative to day 9 in the DN-POLG cells following hierarchical clustering; error bars represent standard error of the mean.

