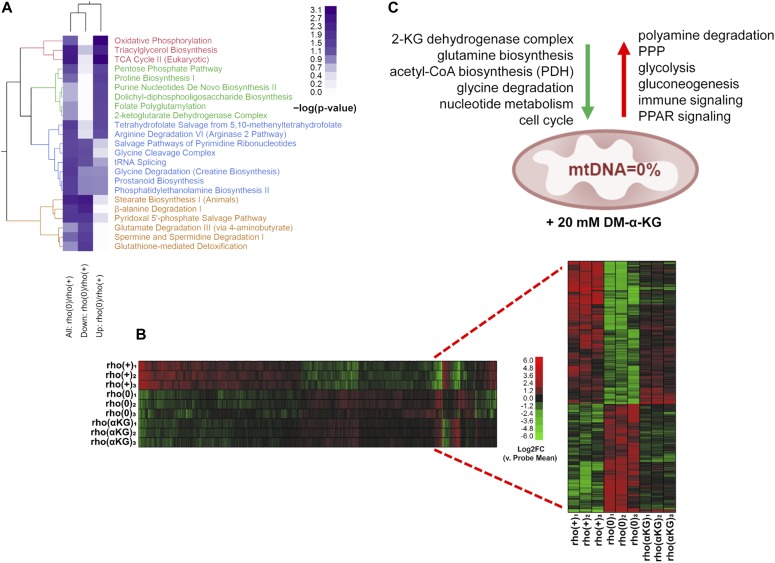
Figure 5. Treatment with DM-α-KG rescues gene expression in the context of chronic mtDNA depletion.
(A) Heatmap of significantly represented canonical metabolic pathways per Ingenuity Pathway Analysis based on DEGs when comparing rho+ and rho0. Color intensity of heatmap blocks corresponds to strength of enrichment [−log(P) > 1.3]. (B) Microarrays were performed using RNA from rho+, rho0, or rho0 pretreated with DM-α-KG; N = 3 per sample. Inset show data from the 596 genes that were impacted by the treatment. (C) Schematic representation of the main transcriptional responses reversed in the rho0 cells by DM-α-KG exposure; green and red arrows indicate down-regulated and up-regulated signaling pathways, respectively, after treatment.

