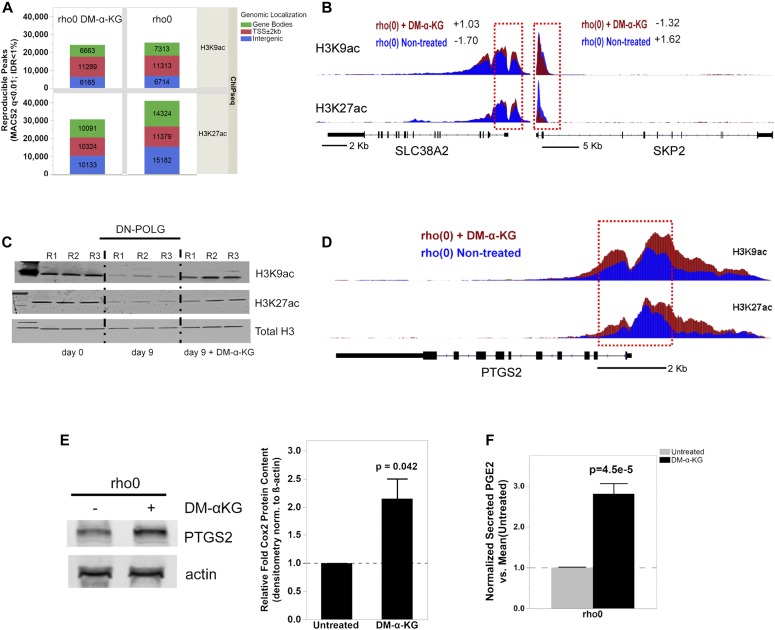
Figure 6. Exposure to DM-α-KG reverses locus-specific H3Kac marks in 143B rho0 cells on the genes affected by the same treatment.
(A) Stacked bar plots of genomic localization for H3K9ac (top) and H3K27ac (top) detected reproducible peaks (q < 0.01, IDR < 1%) by ChIP-seq with respect to gene coordinates in 143B rho0 cells with or without 4 h supplementation with 20 mM DM-α-KG in culture. (B) Graphical representation of the H3K9ac and H3K27ac RPM values in two genes differentially expressed in rho0 cells (relative to rho+) with (red) and without (blue) DM-α-KG supplementation; black bar indicates the gene and the vertical bars within depict the exons. Numbers reflect the fold-change relative to rho+ in non-treated or DM-α-KG-exposed rho0 cells. Tracks for SLC38A2 (solute carrier family 38 member 2) and SKP2 (S-phase kinase-associated protein 2) are representative. (C) DN-POLG cells were treated with doxycycline to induce mtDNA depletion, and at day 9, the cells were exposed for 4 h to 20 mM DM-α-KG. Histones were extracted and acetylation levels of H3K9 and H3K27 were probed using antibodies; data show immunoblots of three independent cultures (R1–R3). Total histone H3 was used as loading control. (D) Same as (B) but for the PTGS2 gene. (E) Representative Western blots of PTGS2 in rho0 cells before and after 4-h exposure to DM-α-KG; graph shows mean of three independent biological replicates. (F) Levels of PGE2 were estimated using ELISA in the supernatant of cells used for (E) N = 3. Data were normalized to total protein content; ANOVA was used to gauge statistical differences; error bars represent ±SEM (E, F).

