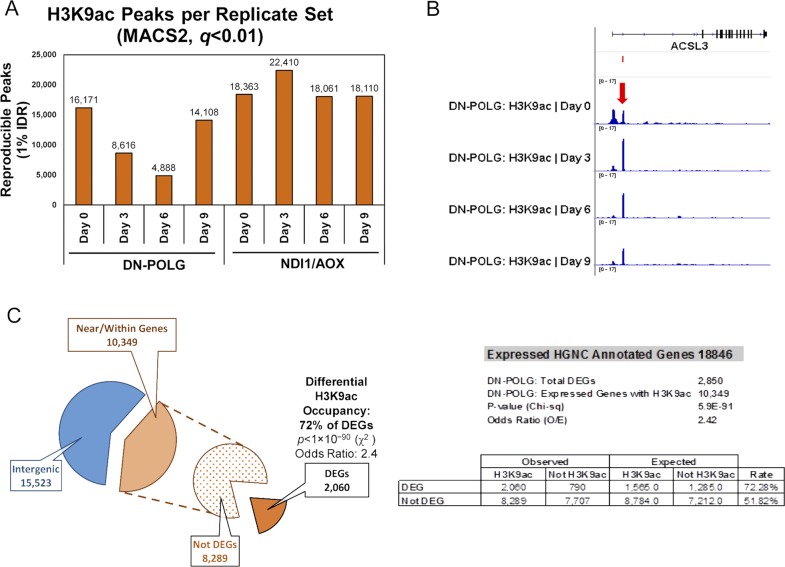
Figure S1. Detection of H3K9ac enrichment peaks during the 9-d timeframe of dox-induced mitDNA depletion by ChIPseq.
(A) Number of reproducible H3K9ac enrichment peaks v. input DNA genome-wide at days 3, 6, or 9 versus day 0 (MACS2, q < 0.01, 1% IDR); left panel shows DN-POLG and right panel depicts data for the NDI1/AOX (N = 2 each cell type). (B) Screen shot of a gene exemplifying DEGs that follow the pattern of cluster B in DN-POLG cells (see Fig 1B). Top represents gene structure, the peak on the left falls on the annotated promoter; peak on the right is on the gene body in a non-annotated area. (C) Depiction of the percentage of peaks identified in the DN-POLG cells based on genomic locations. The odds ratio of a DEG having a change in H3K9ac occupancy was calculated based on the expected versus observed instances in which it occurred in DEGs and in non-DEGS.

