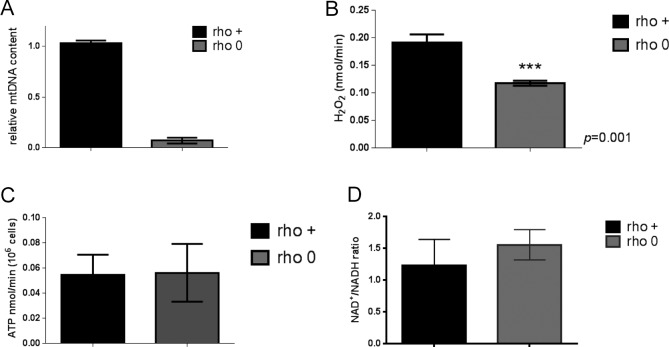
Figure S2. Biochemical parameters of 143B cells.
(A) Relative mtDNA content was estimated using quantitative PCR; N = 3; error bars depict SEM. (B) Levels of H2O2 were determined using Amplex red and a standard H2O2 curve. Data were normalized to cell number; N = 3. (C) ATP levels were estimated using a fluorescent kit and deproteinized cellular lysates. N = 3; data were normalized to cell number. (D) NAD+/NADH ratios were estimated using a commercially available kit in which the NAD+- or NADH-containing pool is measured separately. The ratio between the two is depicted in the graph. N = 3. t test was used to define statistical differences; error bars reflect ±SEM.

