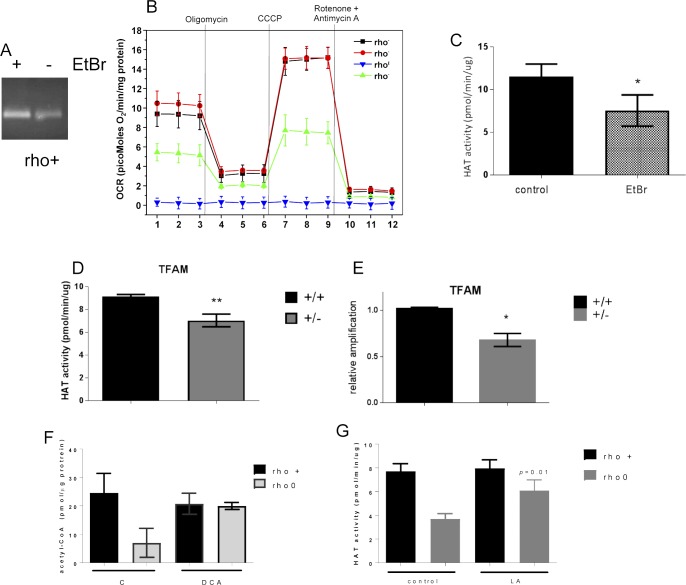
Figure S3. Decreased levels of mtDNA do not support full HAT activity.
(A) PCR products from a 221-bp fragment of the mtDNA in rho+ before and after treatment with EtBr for 1 wk was ran on a 2% agarose gel. Reactions included the same amount of starting genomic DNA (15 ng) for 20 cycles. (B) Bioenergetics parameters of the cells was determined by extracellular flux analysis using the Seahorse. Individual traces for oxygen consumption rate (OCR) are depicted upon addition of the various ETC inhibitors, including olygomycin, rotenone, antimycin and the uncoupler CCCP. Data were normalized to protein concentration; each sample was present in quadruplicates. Samples included were control (rho+) grown under glucose or galactose supplementation and rho+ freshly treated with ethidium bromide for 7 d and rho0. (C) HAT activity was performed in rho+ cells treated with EtBr for 2 wk (N = 3) and (D) using TFAM wild type or heterozygote MEFs (N = 3 per cell type). (E) Relative mtDNA content in the same samples was estimated as in A relative to TFAM +/+. (F) Total levels of acetyl-CoA were estimated in rho+ and rho0 cells treated with 20 mM sodium DCA for 4 h using deproteinized samples in a fluorescent-based assay and a standard acetyl-CoA curve. N = 3 biological replicates. (G) HAT activity was performed in rho+ and rho0 cells after exposure for 4 h to 5 mM (±)-α-lipoic acid (LA; N = 3). t test was used to define statistical differences; in all panels, error bars represent ±SEM.

