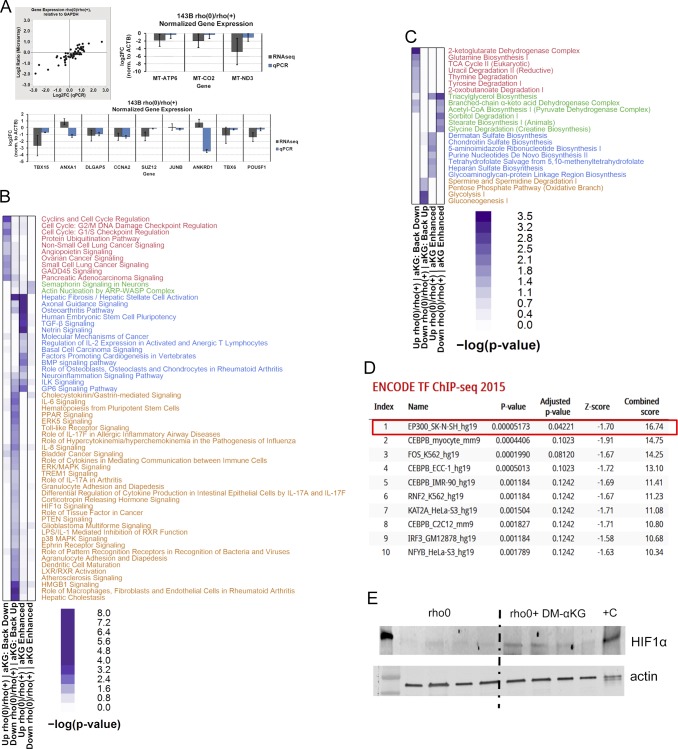
Figure S6. Validation and pathway enrichment analysis of genes rescued by DM-α-KG treatment of rho0 cells based on microarray experiments.
(A) qPCR validation of genes detected in 143B cells by microarrays. Left upper panel depicts concordance of relative expression estimates in 143B rho0 versus rho+ cells normalized to house-keeping GAPDH between microarray (HG-U133 Plus 2.0; Affymetrix) and qPCR experiments (Human Amino Acid Metabolism Tier I PrimePCR panel; Bio-Rad) for 65 nuclear-encoded genes; qPCR was performed from cDNA templates derived using the same total RNA extracts for both techniques (N = 3 per cell derivative) and were performed in technical triplicates. Right upper and bottom panels show graphs of relative expression estimates in 143B rho0 versus rho+ cells normalized to β-actin (ACTB) between RNA-seq and qPCR experiments (Custom PrimePCR panel; Bio-Rad) for three mtDNA-encoded genes (right upper panel) and nine nuclear DNA-encoded genes (bottom panel); qPCR was performed from cDNA templates derived using the same total RNA extracts for both techniques (N = 3 per cell derivative) and were performed in technical triplicates. The genes identified by microarrays in the rho0 cells relative to rho+ whose expression were affected by treatment with DM-α-KG were used to define enriched pathways based on IPA analysis. (B) canonical pathways (C) only metabolic pathways. (D) The list of genes whose expression was reversed by DM-α-KG supplementation was used to retrieve ENCODE-based ChIP-seq information. The table indicates the proteins against which the ChIP-seq experiments were performed, followed by cell type and reference genome (Hg19, human, mm9, and mouse). (E) Rho0 cells were exposed to DM-α-KG and immediately after cells lysed and probed for HIF1α stabilization. Data from four independent biological replicates are shown. As positive control, the cells were exposed to hypoxia (0% O2) for 2 h.

