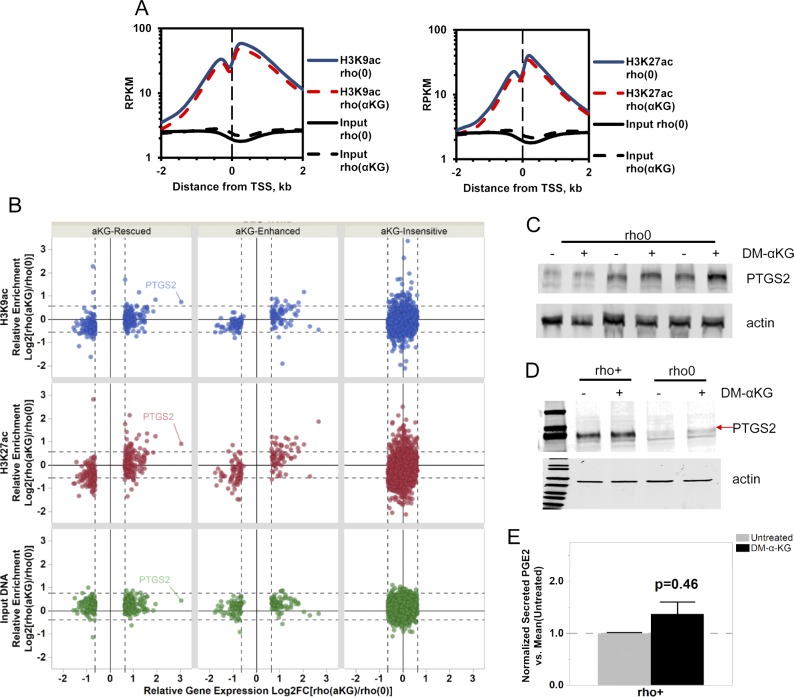
Figure S7. Effects of DM-α-KG treatment on histone marks and prostaglandin levels.
(A) Enrichment of peak abundance was evaluated by calculating the AUCs of ChIP-seq tags (RPM-adjusted ChIP minus RPM-adjusted background, length adjusted) obtained in rho0 before and after DM-α-KG exposure for peaks within a distance of 2 kb from gene TSS. (B) Concordance between gene expression directionality (x-axis) and relative enrichment levels (y-axis) of H3K9ac (blue), H3K27ac (red), and input DNA (green) ChIPseq read densities within 2 kb around the TSS of genes responsive to supplementation with 20 mM DM-α-KG in 143B rho0 before [rho (0)] and after [rho (aKG)] 4-h treatment. Each dot represents a gene; PTGS2 is highlighted as a reference. (C) Western blots for PTGS2 in three independent biological replicates of rho0 cells treated with DM-α-KG (including from Fig 4E). ANOVA was used for statistical significance testing. (D) Same as (C) but when rho+ cells and rho0 were exposed to DM-α-KG for 4 h in parallel experiments. (E) Levels of PGE2 were estimated by ELISA in the supernatant of the rho+ cells used in (D) before and after 4 h exposure to DM-α-KG; N = 3. Data were normalized to total protein content; error bars are ± SEM.

