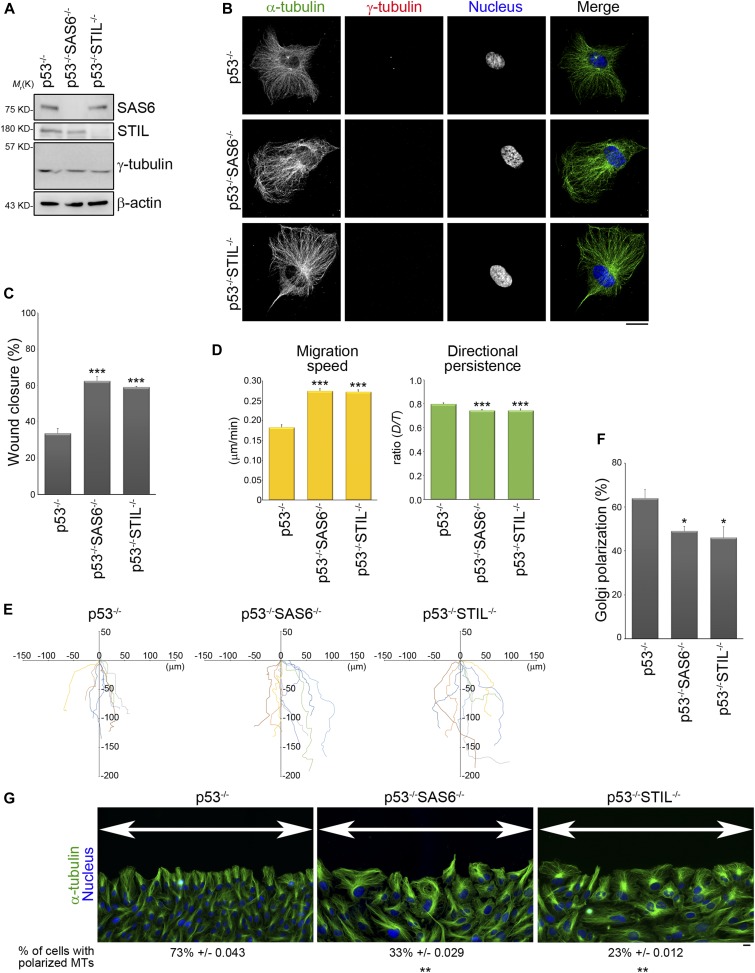
Figure 1. The absence of the centrosome suppresses the cell polarity of a migrating cell.
(A) Western blot analysis of cell lysates obtained from RPEp53−/−, RPEp53−/−SAS6−/−, and RPEp53−/−STIL−/−cells (loaded with equal amounts of total protein) using SAS6, STIL, γ-tubulin, and β-actin antibodies. (B) Confocal images of immunolocalized α-tubulin (to visualize microtubules; green), γ-tubulin (to visualize centrosome; red), and DAPI (to visualize nucleus; blue) in RPEp53−/−, RPEp53−/−SAS6−/−, and RPEp53−/−STIL−/−cells. Scale bar, 20 μm. (C) The percentage of wound closure. Data are mean ± SEM (RPEp53−/−, n = 4 independent experiments; RPEp53−/−SAS6−/−, n = 4 independent experiments; and RPEp53−/−STIL−/−, n = 3 independent experiments). ***P < 0.001, compared with RPEp53−/−. (D) The migration parameters were calculated as described in the Materials and Methods section. Migration speed was calculated as the total length of the migration path divided by the duration of migration; directional persistence was calculated as the net migration distance divided by the total length of the migration path. Data are mean ± SEM (n = 100 cells for each conditions). ***P < 0.001, compared with RPEp53−/−. (E) Analysis of migration trajectories. The trajectories of representative cells are plotted. The origins of migration are superimposed at (0, 0). (F) The percentage of Golgi reorientation. The percentage of wound-edge cells with their Golgi apparatus in the forward-facing 120° sector was measured at 3 h after wounding. For each experiment, 100 cells were scored. Data are mean ± SEM (n = 3 independent experiments). *P < 0.05, compared with RPEp53−/−. (G) RPEp53−/−, RPEp53−/−SAS6−/−, and RPEp53−/−STIL−/−cells were immunostained with α-tubulin (green) and DAPI (blue) at 3 h after wounding. The high magnification wide field-of-view (epi-fluorescence) images were generated by automatically stitching multiple adjacent frames from a multipoint using the Nikon analysis software NIS-Elements. Arrows indicate the direction of the wound. Scale bar, 20 μm. The values indicate the percentage of cells with polarized microtubules. For each experiment, 100 cells were scored. Data are mean ± SEM (n = 3 independent experiments). **P < 0.01, compared with RPEp53−/−.

