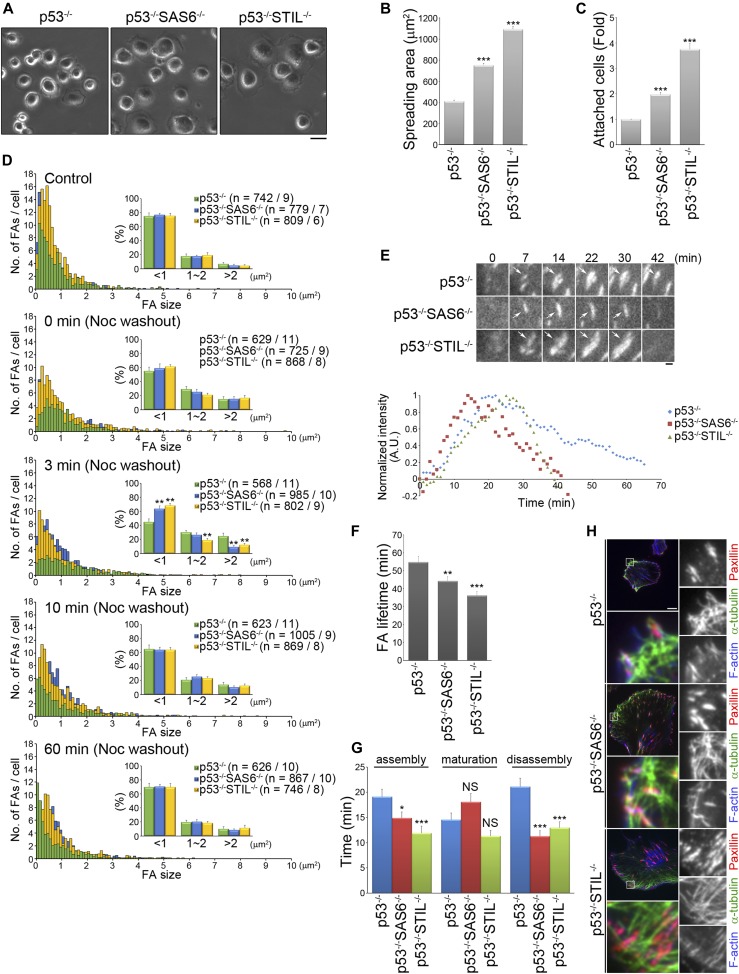
Figure 3. The absence of the centrosome changes FA dynamics in a migrating cell.
(A) RPEp53−/−, RPEp53−/−SAS6−/−, and RPEp53−/−STIL−/−cells were plated on coverslips coated with fibronectin (10 μg/ml) for 15 min and then images were captured by phase-contrast microscopy. Scale bar, 20 μm. (B) The plot shows the area of cells spreading on coverslips coated with fibronectin (10 μg/ml) for 15 min. Data are mean ± SEM (n = 200 cells for each conditions). ***P < 0.001, compared with RPEp53−/−. (C) RPEp53−/−, RPEp53−/−SAS6−/−, and RPEp53−/−STIL−/−cells were plated on 96-well plates coated with fibronectin (10 μg/ml) for 30 min and then their cell attachment was measured. Fold of cells (relative to RPEp53−/− cells) that remained attached to the fibronectin-coated plates. Data are mean ± SEM (n = 6 independent experiments). ***P < 0.001, compared with RPEp53−/−. (D) Size distribution of segmented FAs from RPEp53−/−, RPEp53−/−SAS6−/−, and RPEp53−/−STIL−/−cells, before treatment with nocodazole (control) and at 0, 3, 10, and 60 min after nocodazole washout. Data are mean ± SEM (n = number of FAs/number of cells). **P < 0.01, compared with RPEp53−/−. (E) Top: time-lapse TIRF microscopy images of GFP-paxillin during FA turnover in migrating RPEp53−/−, RPEp53−/−SAS6−/−, or RPEp53−/−STIL−/−cells as indicated. Scale bar, 1 μm. Bottom: normalized fluorescent paxillin intensity over time in FA marked with arrows in the images. (F) FA lifetime in RPEp53−/−, RPEp53−/−SAS6−/−, and RPEp53−/−STIL−/−cells as indicated (RPEp53−/−: 54.84 ± 3.13 min; RPEp53−/−SAS6−/−: 44.29 ± 2.37 min; and RPEp53−/−STIL−/−: 36.25 ± 2.27 min). (G) The duration of FA assembly, maturation, and disassembly in RPEp53−/−, RPEp53−/−SAS6−/−, and RPEp53−/−STIL−/−cells as indicated. In (F) and (G), RPEp53−/−: 46 FAs/7 cells; RPEp53−/−SAS6−/−: 44 FAs/7 cells; and RPEp53−/−STIL−/−: 46 FAs/7 cells, data are mean ± SEM. *P < 0.05; **P < 0.01; ***P < 0.001; NS, no significance, all compared with RPEp53−/−. (H) TIRF microscopy images of immunolocalized α-tubulin (green), paxillin (to visualize FAs; red), and phalloidin (to visualize F-actin; blue) in RPEp53−/−, RPEp53−/−SAS6−/−, and RPEp53−/−STIL−/−cells. Scale bar, 10 μm. The 8 × 8 μm areas indicated in the upper-left images are magnified in the merged and right three images.

