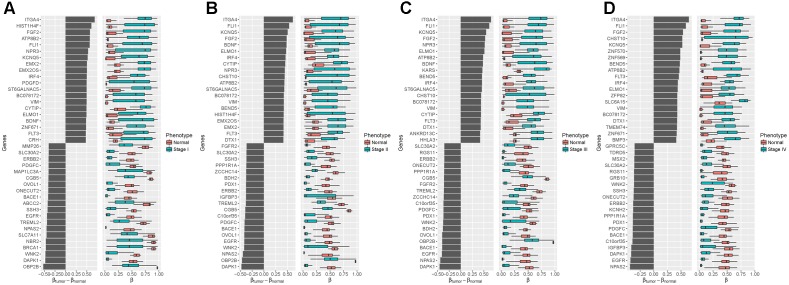
FIGURE 4.
Differentialmethylation analysis between four tumor stages and the normal phenotype (A): Stage I vs. Normal; (B): Stage II vs. Normal; (C): Stage III vs. Normal; (D): Stage IV vs. Normal. Left: Mean difference between the methylation level in the tumor samples and the normal samples. Right: Distributions of methylation level, with black vertical lines showing medians. Top 20 of the largest positive and negative mean differences with an adjusted p-value less than 0.05 are shown.

