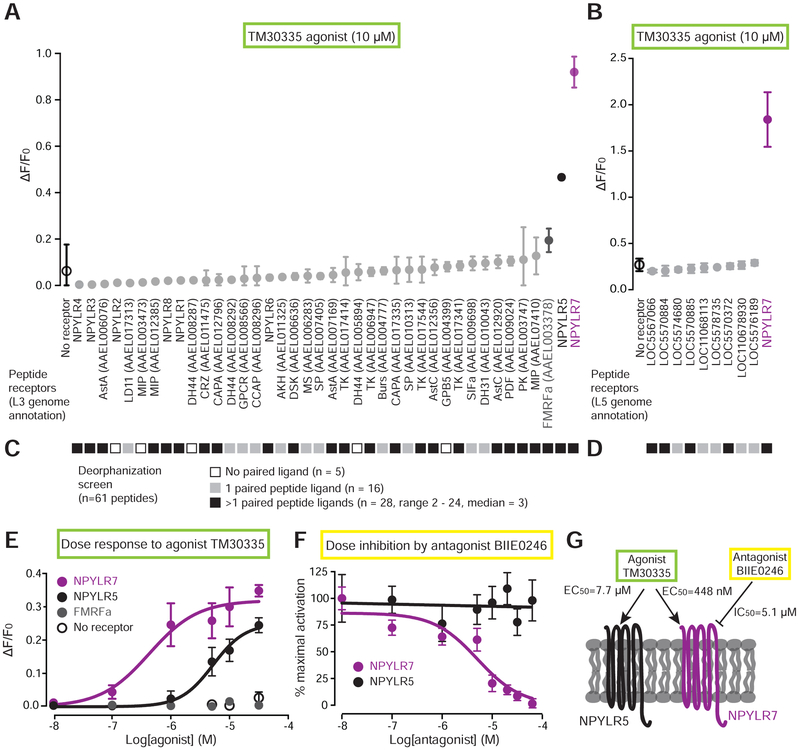
Figure 3. In vitro screen identifies NPY-like receptor 7 as the target of behaviorally active compounds.
(A-B) Response to TM30335 of all Ae. aegypti peptide receptors annotated in the L3 genome assembly and annotation (A) and additional receptors annotated in the L5 genome assembly and annotation (B) (mean ± SD, n=3 trials, 4 replicates/trial). Non-gray data points are statistically different from non-transfected control (black open circle), one-way aNoVA with Bonferroni correction, p<0.001.
(C-D) In vitro response of 61 predicted Ae. aegypti peptides against all predicted peptide receptors in the L3 genome annotation (C) and the L5 genome annotation (D). See Data S1 for raw data.
(E) Dose-response curve of TM30335 against the indicated receptors. NPYLR7 EC50 = 448 nM, NPYLR5 EC50 = 7.7 μM calculated using log(agonist) versus response nonlinear fit (mean ± SD, n=3 trials,4 replicates/trial).
(F) Dose-inhibition curve of TM30335 activation NPYLR7 and NPYLR5 responses by BIIE0246. NPYLR7 IC50 =5.1 μM calculated using log(inhibitor) versus response nonlinear fit (mean ± SD, n=3 trials, 4 replicates/trial).
(G) Summary of in vitro findings.

