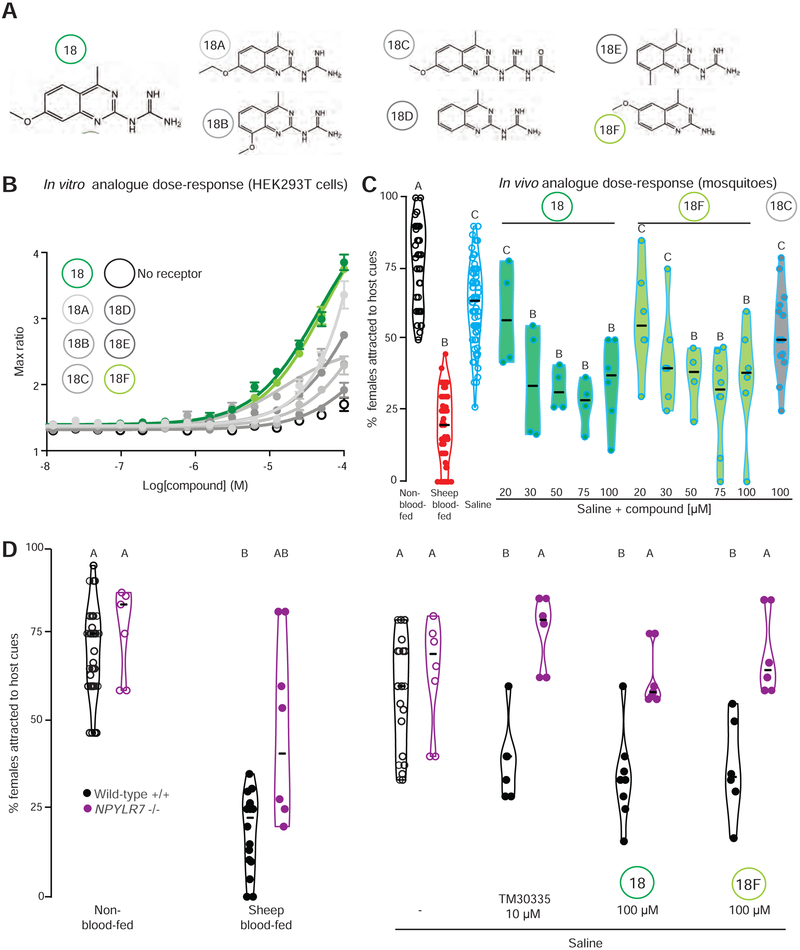
Figure 6. Small molecule screen compounds target Ae. aegypti NPYLR7 with high specificity in vitro and in vivo.
(A) Chemical structures of compound 18 and six structural analogues.
(B) In vitro dose-response curve of compounds in (A) against NPYLR7 (mean ± SEM, n=1, 3 replicates/trial)
(C) Host-seeking in a miniport olfactometer 2 days after feeding the indicated meals (n = 4 – 82, 15 - 25 females/trial)
(D) Host-seeking in a miniport olfactometer 2 days after feeding the indicated genotypes with the indicated meals (n = 4-26, 15 - 25 females/trial).
Data in C-D are plotted as median with range. Data labeled with different letters are significantly different from each other (Kruskal-Wallis test with Dunn’s multiple comparison, p<0.05). Experimental groups denoted “AB” are not significantly different from either A or B groups.

