. 2019 Jan 25;9(7):3570–3576. doi: 10.1039/c8ra09069f

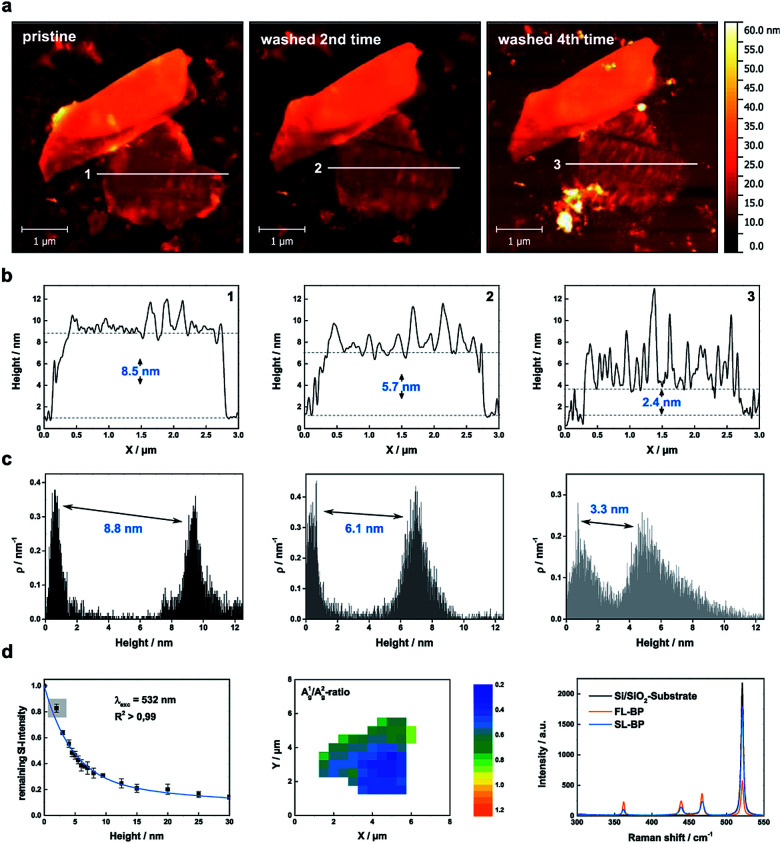
Fig. 2. Thinning down to the monolayer limit. (a) AFM images of a micromechanically exfoliated BP flake, which has been rinsed up to 4 times with DI water in order to reach the monolayer limit. (b) Corresponding AFM height profiles along lines 1–3 demonstrating the reduced thickness of the flake. (c) Statistical AFM evaluation recorded in the monolayer region of the BP flake which relate nicely to the AFM height profiles. (d) Raman characterization of the BP flake: (Left). The remaining Si attenuation curve was extended by the point at 2.4 nm. Single layered BP has a remaining Si intensity higher than 80% in comparison to the pure substrate which represents a nice estimation tool. (Middle) Corresponding Raman mapping of the A1g/A2g-ratio of the BP flake after 4 times of washing with DI water. (Right) Mean Raman spectra of the pure substrate, the monolayer region of the BP flake (blue) and the thicker part of the BP flake (orange) highlighting the difference in the remaining Si attenuation.

Fig. 2