. 2019 Jan 7;19(3):503–512. doi: 10.1039/c8lc01259h

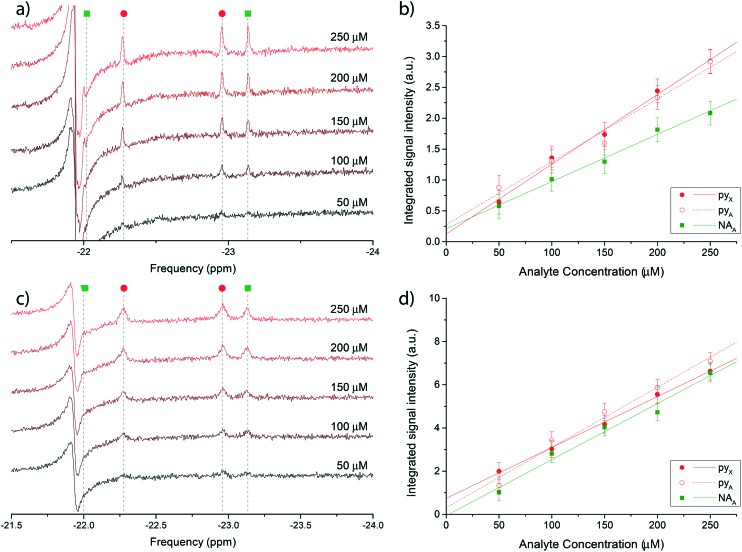
Fig. 4. a) Single scan 1H @500 MHz NMR spectra of a nicotinamide and pyridine concentration series ranging from 50 μM to 250 μM, performed in bulk on a Bruker Micro-5 NMR probe. Only the di-hydritic region is displayed. c) 128-averaged spectra of the concentration series recorded on the micro-NMR setup. Peak assignment in (a) and (c) follows the colour scheme reported in Fig. 3. (b and d) Corresponding signal integrals of di-hydride peaks in plots (a) and (c) as a function of nominal nicotinamide and pyridine concentrations. The X hydride for nicotinamide was not quantified due to the overlap with a constant antiphase signal in the same region. The mass sensitivity range corresponding to the concentration range covered by the experiments is 15–75 pmol.

Fig. 4