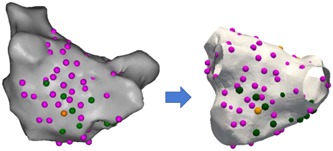
Figure 2.

An example of a patient’s CARTO left atrial image (posterior‐anterior view) with A‐AVD‐GP (green), B‐AVD‐GP (orange), and high frequency stimulation negative sites (pink) transformed onto a reference left atrial shell. A‐AVD‐GP, asystole atrioventricular dissociating ganglionated plexus; B‐AVD‐GP, bradycardia atrioventricular dissociating ganglionated plexus [Color figure can be viewed at wileyonlinelibrary.com]
