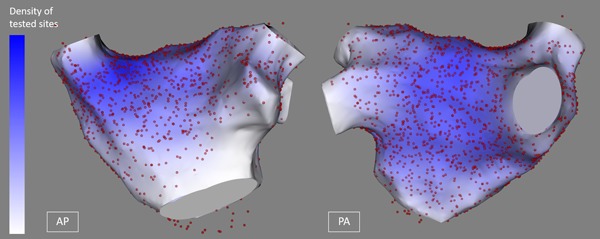
Figure 7.

All AVD‐GPs and high frequency stimulation negative sites in 28 patients on the reference left atrial shell. Red spots represent high frequency stimulation site tested and the color scale on the left‐hand side represent the density of high frequency stimulation points tested (darkest blue representing highest density) in the left atrium. AVD‐GP, atrioventricular dissociating ganglionated plexus [Color figure can be viewed at wileyonlinelibrary.com]
