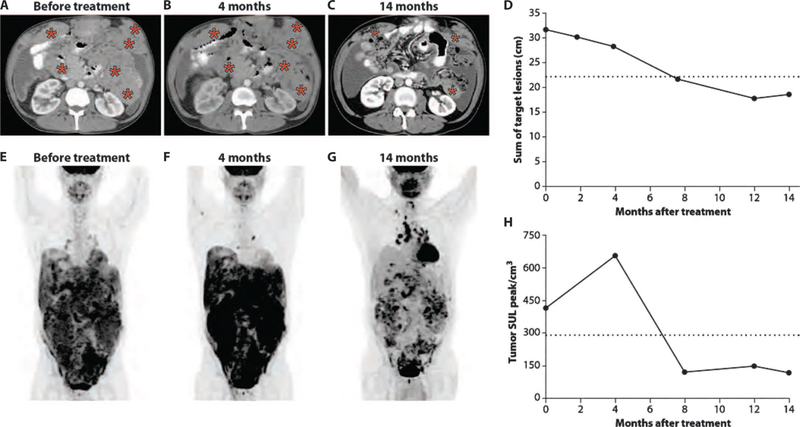
Fig. 3. Delayed tumor response in a patient with peritoneal mesothelioma.
(A to C) Representative CT images of the abdomen for patient 2 before treatment and at 4 and 14 months after therapy, respectively. There was no objective tumor regression at 4 months (B), but a CT obtained at 7 months showed a partial response that had been maintained at 14 months of follow-up (C). Tumor involvement is indicated by red asterisks. (D) The magnitude of tumor response in this patient is shown by graphing the sum of target lesions to time points at which CT scans were obtained. The horizontal dashed line represents partial response, defined as a 30% reduction in the sum of target lesions from pretreatment CT scan. (E to G) PET images from the time points shown in (A) to (C), respectively. (H) Change in tumor metabolic activity as measured by SULpeak/cm3 before therapy and at different time points after treatment. The horizontal dashed line represents metabolic partial response, as described in (25).

