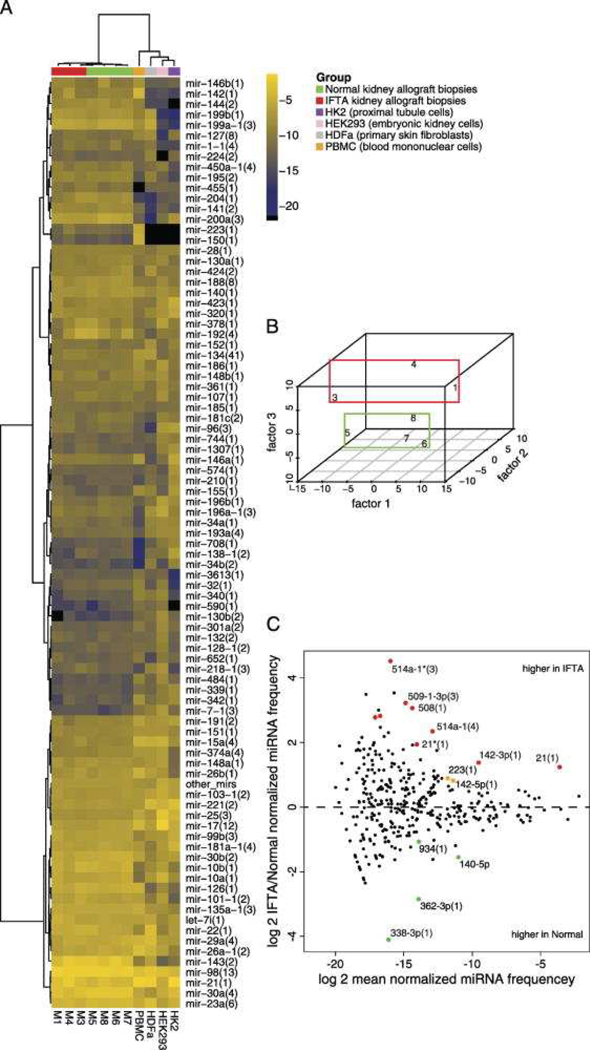
Figure 4. MicroRNA profiles generated by small RNA sequencing distinguish human kidney allograft biopsies with fibrosis from normal allograft biopsies.

This Figure depicts the miRNA profiles generated by small RNA sequencing. A, Hierarchical clustering and heatmap representation of kidney allograft biopsies with fibrosis (IFTA, Interstitial fibrosis and tubular atrophy) and normal allograft biopsies, human peripheral blood mononuclear cells (PBMC), HDFa (primary skin fibroblast), HEK293 cells (human embryonic kidney cells), and HK2 cells (kidney proximal tubule cells) according to merged miRNA profiles. B, Multidimensional scaling showing separation of IFTA biopsies from Normal biopsies. C, MA plot showing the differentially expressed miRNA sequence families. Colored data points represent P<0.05 (red points signify in addition FDR<0.1) (From Ben-Dov IZ, Muthukumar T, Morozov P, et al. MicroRNA sequence profiles of human kidney allografts with or without tubulointerstitial fibrosis. Transplantation. 2012;94(11):1089; with permission).
