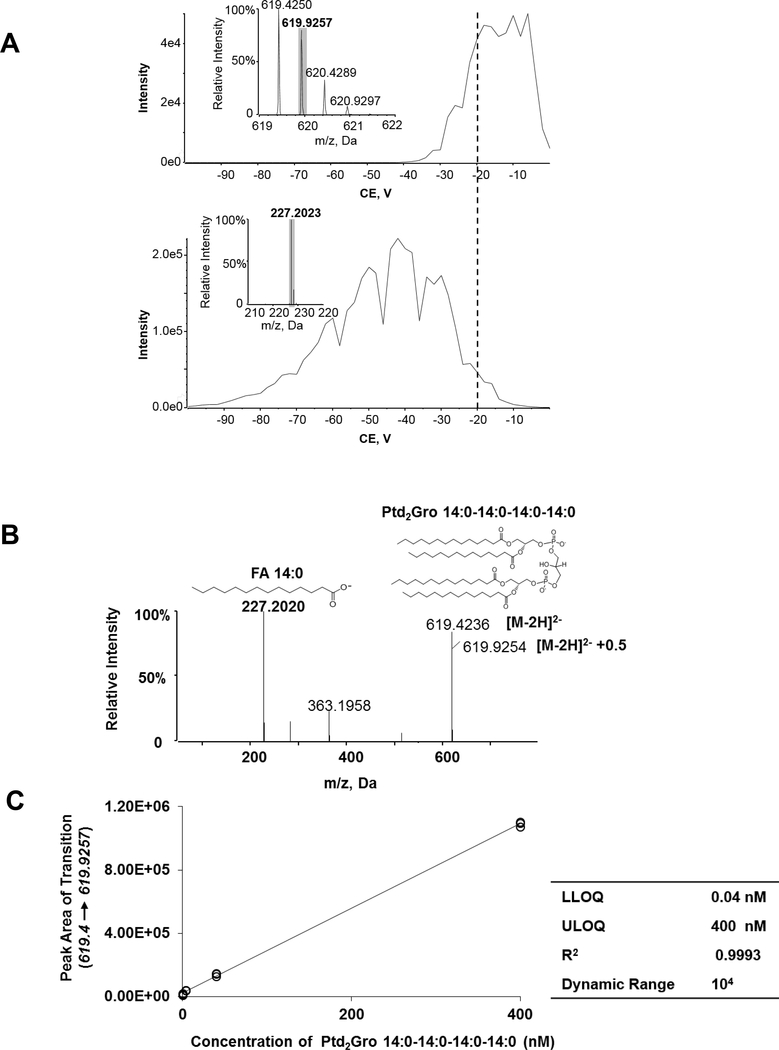
Figure 3. Optimization of high-resolution shotgun lipidomics for cardiolipin.
(A) Plot of Intensity of the isotopic [M-2H]2- +0.5 peak (m/z 619.9257) (upper panel) and of the fatty acid fragment m/z 227.2023 (lower panel) of Ptd2Gro 14:0–14:0–14:0–14:0 against varying rolling collision energy (CE). (B) MS/MS spectra and fragments of Ptd2Gro 14:0–14:0–14:0–14:0 at the CE=−20 V. (C) The peak area of the isotopic ion [M-2H]2- +0.5 (619.4 → 619.9257) against the concentration of Ptd2Gro 14:0–14:0–14:0–14:0 yielded a linear curve (R2 = 0.9993) when spiked in mouse tissue. The insert table shows the related quantitative parameters. The spectra were acquired using the MS/MSALL for cardiolipin under the following conditions: GS1=10, GS2=10, CUR=15, Temp=300 °C, DP=100 V. CE, collision energy; Ptd2Gro, cardiolipin; CUR, curtain gas; DP, declustering potential; FA, fatty acid; GS, nitrogen gas flow; LLOQ, the lower limit of quantification; ULOQ, the upper limit of quantification.; Temp, temperature.

