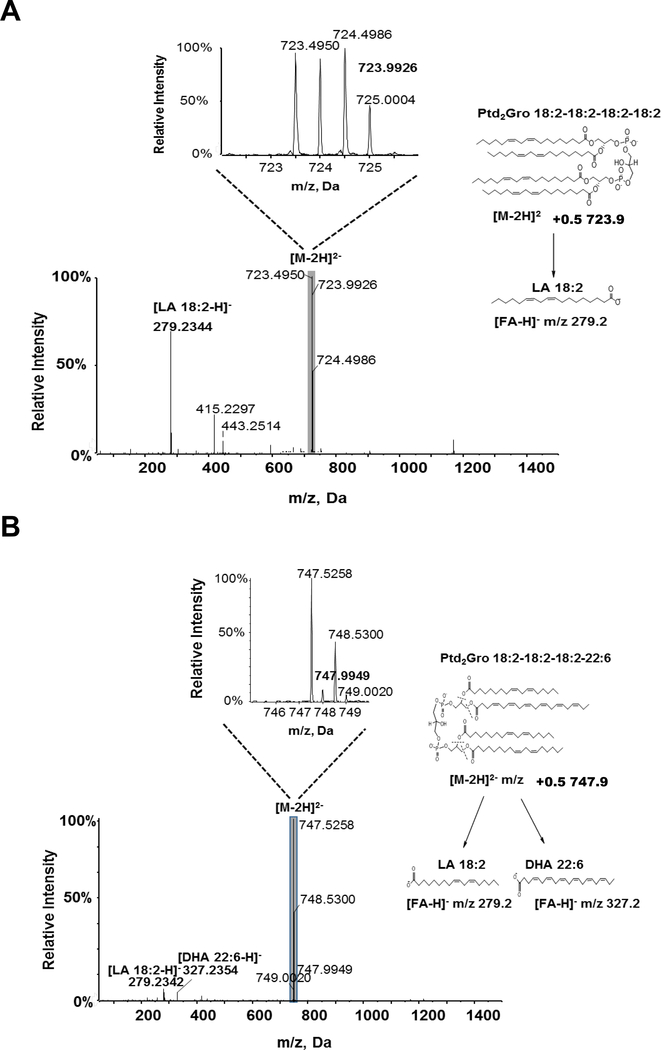
Figure 6. MS/MS spectra and fragmentation pattern for Ptd2Gro species identified from mouse heart.
(A) Species Ptd2Gro 18:2–18:2–18:2–18:2 and (B) 18:2–18:2–18:2–22:6 were identified from mouse heart. Insets: The enlarged isotopic distribution of [M-2H]2- of Ptd2Gro species. The spectra were obtained using the MS/MSALL for Ptd2Gro under the following conditions: GS1=10, GS2=10, CUR=15, Temp=300 °C, DP=100 V, CE=−20 ± 10 V. DHA, docosahexaenoic acid; LA, linoleic acid

