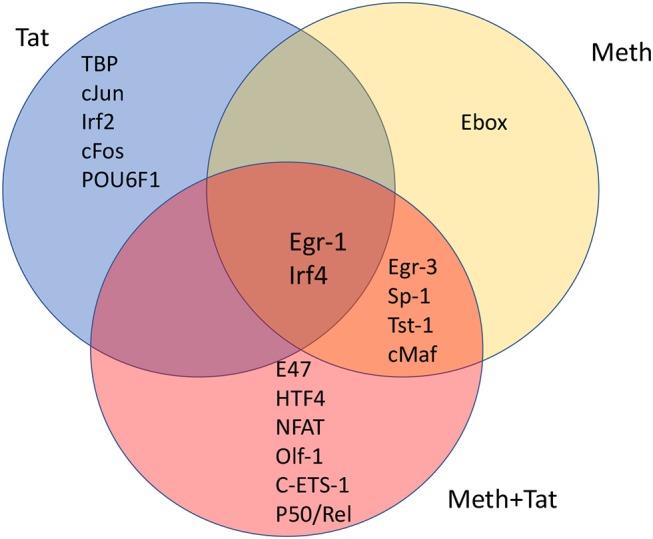
Figure 4.

Venn's diagram showing transcription factors with frequent binding motifs among genes with significant changes in RNA Pol II recruitment, immediately following the stimulation of THP1 cells with HIV-1 Tat, Meth, or both together. Matrices for transcription factor binding motifs were generated from ChIP-seq data. For that, SICER raw data in BED format was loaded into TRANSFAC, and the Match-algorithm, was applied as binding factor identifier. Transcription factors with highest frequency of binding motifs in gene promoters affected by HIV-1 Tat, Meth, or both together were estimated. The transcription factors listed in each segment of the Venn's diagram are all significantly increased in comparison to control conditions, and are ranked in order according to frequency matrices, from highest on top to lowest at the bottom of the segregated lists.
