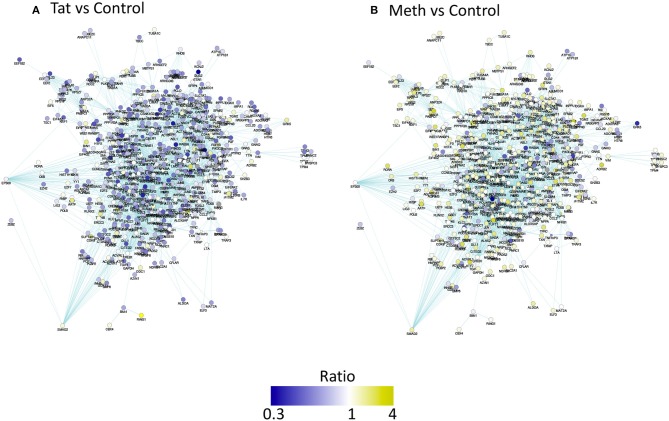
Figure 5.
Pathway-based network association of genes with promoter activity changes due to HIV-1 Tat or Meth, compared to vehicle treatment. Ratio between RNA Pol normalized peak values between treated conditions and controls were used for designing a color-coded visualization. Genes were filtered to display only significantly decreased (blue), and increased (yellow) RNA Pol II recruitment patterns. (A) Visual representation of ratio of Tat over Control and (B) Meth over Control.

