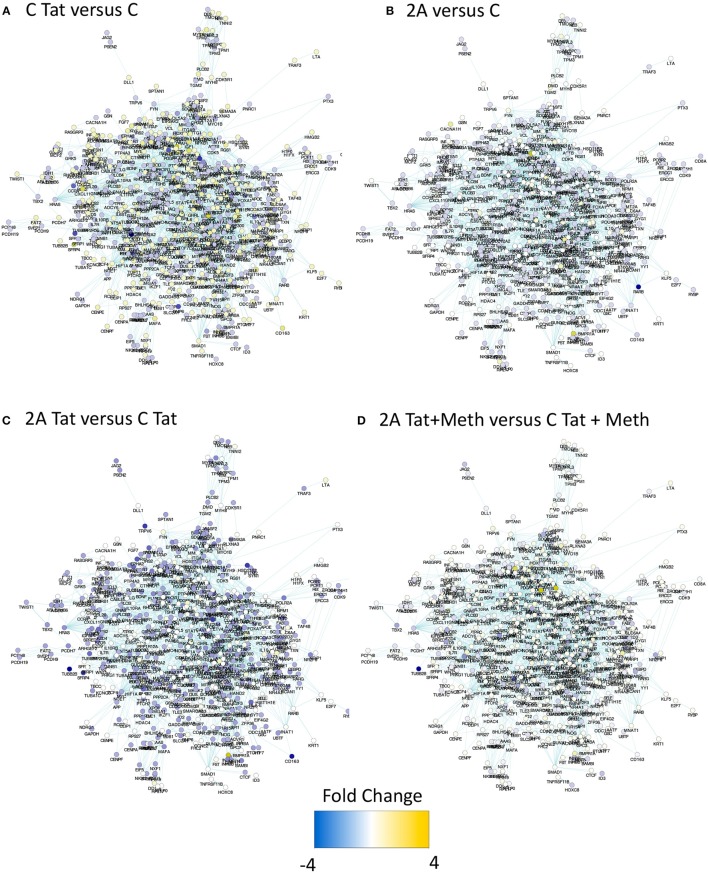
Figure 8.
Impact of TBP deficiency on the expression of genes in the TBP targetome following stimulation with Tat, in the presence and in the absence of Meth. The genes that contain Tata box promoter elements and their relationship was estimated in Homo sapiens 3.4 Biogrid default network using iRegulon, with TBP as a factor, and filtered to contain genes that were significantly represented in THP1 cells based on RNA Pol II recruitment capacity at any given experimental condition. The produced mega-network containing 1811 genes was denominated TBP targetome, and used to determine the effect of TBP depletion on Tat stimulation, alone or in the context of Meth. For that, RNA seq was performed in the control clone C and in the TBP-deficient clone 2A, stimulated with 10 μg/ml of HIV Tat, alone or together with 60 μM of Meth. The expression changes were estimated 24 h after stimulation. Yellow tones represent upregulation, and blue tones represent downregulation. (A) Clone C treated with Tat was compared to clone C treated with vehicle, showing that the majority of the genes in this network are yellow, indicating that Tat upregulates genes with a TBP binding domain. (B) Vehicle-treated clones 2A and C were compared, showing little or no change in color, indicating that they do not differ at baseline. (C) Clone 2A stimulated with Tat was compared to clone C stimulated with Tat, showing that most genes are in blue nodes indicating that clone 2A had a lower expression than clone C, upon Tat stimulation. (D) Clone 2A treated with Tat+Meth was compared with clone C also treateated with Tat+Meth, where nodes with no color change or yellow indicate that in the presence of Meth, the TBP deficient clone 2A either does not differ from clone C or further increases the expression of genes with a TBP binding promoter domain.

