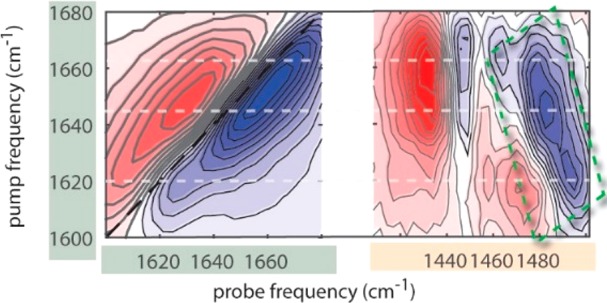
Figure 2.

Isotropic 2D-IR spectra of a 2 wt % AFGP1–5 solution in D2O at 0 °C. The spectra were collected at a delay time Tw of 0.5 ps. The left panel shows the 2D-IR spectrum obtained when exciting and probing in the amide I region, and the right panel shows the 2D-IR spectrum obtained when exciting the amide I region and probing the amide II region. Bleaching (reduced absorption) is indicated in blue, while excited-state absorption (increased absorption) is indicated in red.
