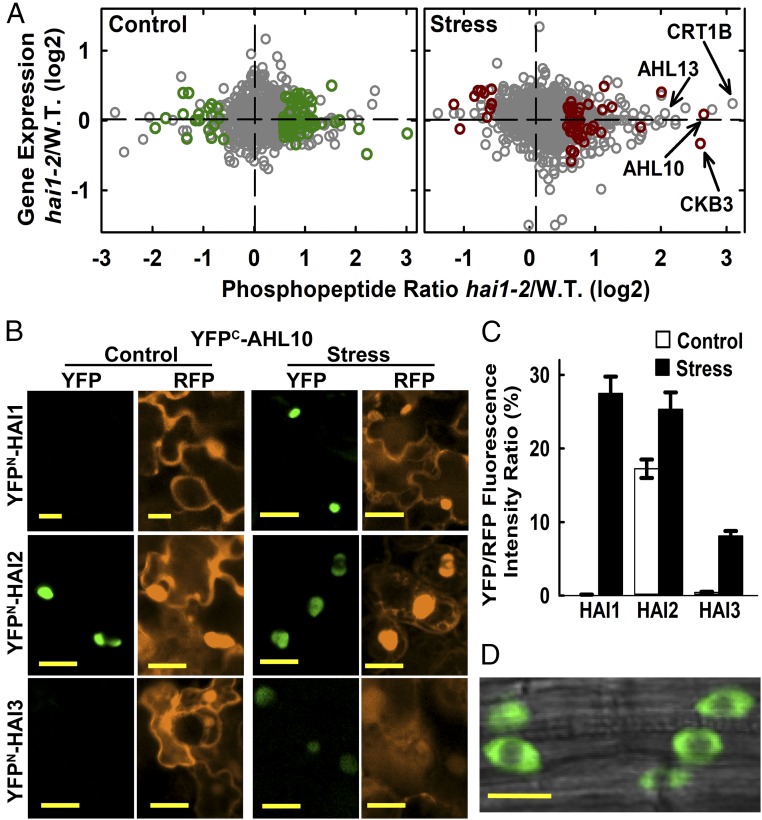
Fig. 1.
Phosphoproteomics of hai1-2 identifies a set of HAI1-affected phosphoproteins, including AHL10. (A) Phosphopeptide abundance versus gene expression for hai1-2 compared with wild type. Dark green or red symbols indicate phosphopeptides with significantly increased or decreased abundance (unadjusted P ≤ 0.05 by one sample t-test and fold change ≥1.5) in hai1-2 compared with wild type for control and stress (−1.2 MPa, 96 h) treatments (Datasets S2 and S3). Other phosphopeptide data are plotted using gray symbols (Dataset S1). Transcriptome analysis of hai1-2 has been previously described (15). (B) rBiFC assays of HAI PP2C interaction with AHL10. Interactions were tested by transient expression in Arabidopsis seedlings under unstressed control conditions or after transfer to −1.2 MPa for 48 h before imaging. Red fluorescent protein (RFP) panels show fluorescence of the constitutively expressed RFP reporter used to normalize the YFP fluorescence. (Scale bars, 20 μm.) (C) Relative quantification of rBiFC interactions shown in B. The mean fluorescence intensity was measured for individual cells, and the ratio of YFP to RFP intensity was calculated. Data are ±SE (n = 20–25) combined from two independent experiments. (D) AHL10 localization in plants expressing AHL10promoter:AHL10-YFP in the ahl10-1 mutant background. Cells in the root tip of unstressed seedlings are shown. An essentially identical localization pattern was observed in stress-treated seedlings. (Scale bar, 10 μm.)

