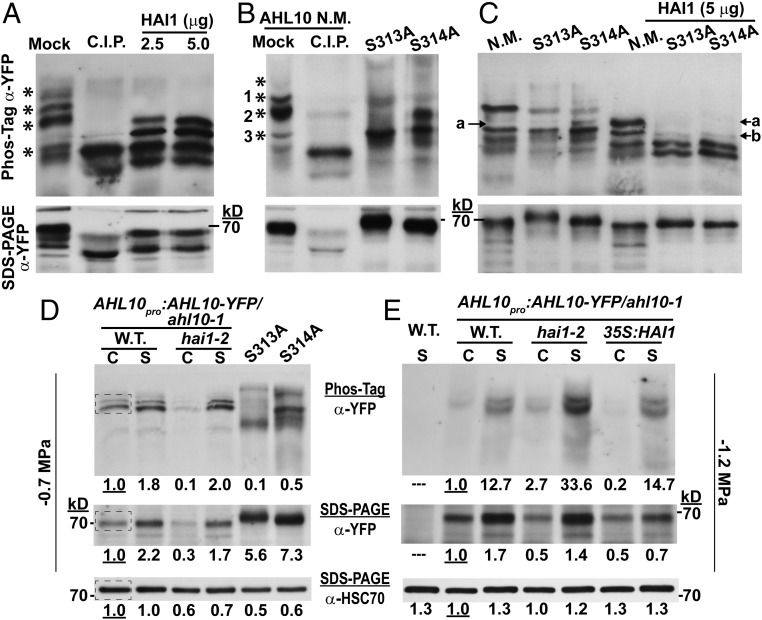
Fig. 2.
Phosphorylated AHL10 increases under stress and can be directly dephosphorylated by HAI1. (A) AHL10-YFP immunoprecipitated from AHL10promoter:AHL10-YFP/ahl10-1hai1-2 plants after exposure to −1.2-MPa stress was dephosphorylated using recombinant HAI1 or C.I.P. Aliquots of the same samples were run on Phos-tag gel or SDS/PAGE. Asterisks (*) along the Phos-tag blot indicate phosphorylated forms of AHL10 that were dephosphorylated (shifted down in the Phos-tag gel) by C.I.P. treatment. The expected molecular weight of AHL10-YFP is 69 kDa. The experiment was repeated with consistent results. (B) Phos-tag gel analysis of N.M. AHL10 as well phospho-null AHL10 (AHL10S313A, AHL10S314A) immunoprecipitated from plants expressing 35S:YFP-AHL10 in the ahl10-1 mutant background. Experimental conditions were the same as for A, and asterisks mark bands of phosphorylated AHL10 present in the N.M. lane that are eliminated by C.I.P. treatment. The expected molecular weight of YFP-AHL10 is 70 kDa. (C) In vitro dephosphorylation of N.M. and phospho-null AHL10 (AHL10S313A, AHL10S314A) immunoprecipitated from plants expressing 35S:YFP-AHL10 in the ahl10-1 mutant background. Experimental conditions were the same as in A except that less starting protein was used for the AHL10S313A and AHL10S314A immunoprecipitation compared with N.M. AHL10 (75 vs. 100 μg, respectively) to ensure that a similar amount of all AHL10 isoforms was used in the dephosphorylation assay. (D) Phos-tag gel analysis of AHL10promoter:AHL10-YFP/ahl10-1 and AHL10promoter:AHL10-YFP/ahl10-1hai1-2 total protein extracted from seedlings in the control (C) and −0.7-MPa stress (S) treatments. Aliquots of the same samples were run on Phos-tag (Top) and SDS/PAGE (Middle) gels, and band intensities of AHL10-YFP were quantified. For comparison total protein extract from 35S:YFP-AHL10 S313A or S314A (in the ahl10-1 mutant background) in the −0.7 MPa treatment was also analyzed. Each lane was loaded with 25 μg of protein. Blots from the SDS/PAGE separation were first probed with anti-YFP to detect AHL10 and then stripped and reprobed with anti-HSC70 as a loading control. The dashed box in the wild-type control lanes indicates the region selected from each lane for quantification of band intensities. Band intensities relative to the wild-type unstressed control are indicated by the numbers below each lane. Note that unphosphorylated AHL10 could not be resolved on these Phos-tag gels because of the relatively low protein loading and long run time needed to resolve phosphorylated AHL10 in total protein extracts. (E) Effect of HAI1 on in vivo phosphorylation status of AHL10 in the −1.2-MPa treatment analyzed by introducing AHL10promoter:AHL10-YFP/ahl10-1 into hai1-2 and 35S:FLAG-HAI1 backgrounds. Aliquots of the same samples were run on Phos-tag (Top) and SDS/PAGE (Middle) gels, and band intensities of AHL10-YFP were quantified (25 µg protein loaded per lane for both gels). The SDS/PAGE blot was stripped and reprobed to detect HSC70 as a loading control. “C” indicates samples from the unstressed control while “S” indicates stress treatment (−1.2 MPa, 96 h). The experiment was repeated with consistent results. Numbers below each lane indicate relative quantitation of band intensities from the same regions of interest indicated in D.

