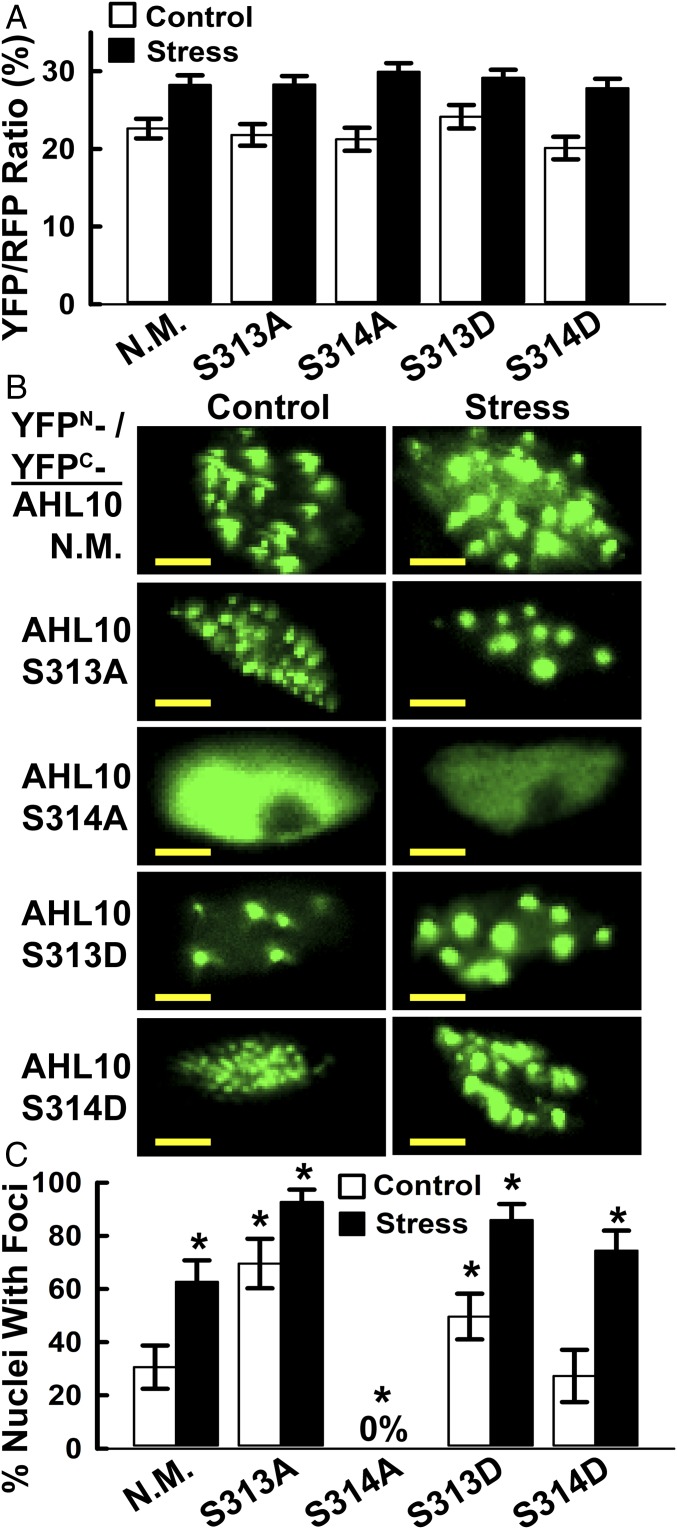
Fig. 5.
rBiFC analysis of self-interaction and nuclear foci localization of phosphomimic and phospho-null AHL10. (A) Quantification of relative self-interaction intensity for phosphomimic and phospho-null AHL10. Data are means ± SE (n = 10–20) combined from two independent experiments. None of the phosphomimic or phospho-null constructs differed significantly from wild type (N.M) AHL10 in either stress or control treatments (t-test P ≤ 0.05). Images of AHL10 self-interaction rBiFC assays are shown in SI Appendix, Fig. S13. (B) Representative images of nuclear foci localization of AHL10 self-interaction complexes observed in rBiFC assays. For N.M. wild-type AHL10 and phosphomimic AHL10S313D and AHL10S314D, representative images of nuclei without foci are shown in SI Appendix, Fig. S13B. Note that nuclei with foci were never observed for AHL10S314A. (Scale bars, 5 μm.) (C) Portion of nuclei with AHL10 foci. Individual nuclei (80–130 for each construct and treatment, combined from two independent experiments) were counted. Error bars indicate 95% confidence intervals, and asterisks indicate significant difference compared with wild type in the same treatment (or difference of wild-type stress versus control) based on Fisher’s exact test (P ≤ 0.05).

