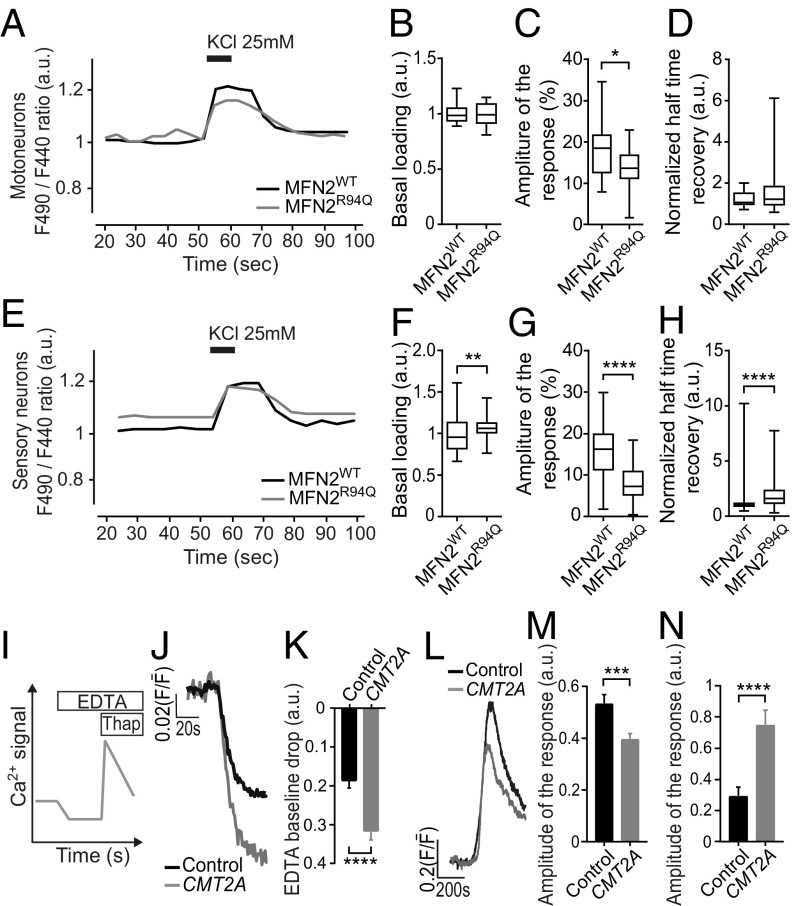
Fig. 5.
MFN2R94Q induces changes in calcium homeostasis both in vitro and in vivo. (A–D) Intracellular calcium measurements using Fura-Red ratiometric imaging (F490/F440) after KCl (25 mM) exposure of MFN2WT (n = 16) and MFN2R94Q (n = 25) motoneurons. (A) An example of obtained recordings. Basal loading was determined as the average of resting calcium concentration (F490/F440, represented as arbitrary units, a.u.) between 20 and 50 s of measurement. (B) Basal loading levels. (C) Amplitude of the maximal response obtained after 8-s exposure to KCl (25 mM), expressed as the percentage of variation relative to basal fluorescence determined in B. (D) Representation of normalized half-time recovery (50% return to basal level normalized by the amplitude of response). (E–H) Intracellular calcium measurements using Fura-Red ratiometric imaging (F490/F440) after 8-s KCl (25 mM) exposure of MFN2WT (n = 105) and MFN2R94Q (n = 81) sensory neurons. (E) An example of obtained recordings. Basal loading was determined as the average of resting calcium concentration (F490/F440, represented as arbitrary units, a.u.) between 20 and 50 s of measurement. (F) Basal loading levels. (G) Amplitude of the maximal response obtained after exposure to KCl (25 mM), expressed as the percentage of variation relative to basal fluorescence. (H) Representation of normalized half-time recovery (50% return to basal level normalized by the amplitude of response). (I–M) Intracellular calcium measurements in control and CMT2A patient-derived fibroblasts evaluated by Fluo-4 AM fluorescent microscopy. Calcium dynamics are expressed as the ratio of fluorescence intensity (F) divided by the mean fluorescence () averaged over the first 50 frames and represented as a.u. (controls, n = 100 and CMT2A, n = 102). (I) A schematic overview of the experimental setting for J–M. (J) Example of a recording obtained in a fibroblast exposed to extracellular EDTA. (K) Quantification of the drop in intracellular calcium determine as a difference between baseline value and the maximal drop in intracellular calcium induced by presence of extracellular EDTA. (L) Example of a recording obtained in a fibroblast exposed to thapsigargin. (M) Quantification of the change determined as a difference between baseline value and the maximal response in intracellular calcium induced by thapsigargin. Values represent the data from three independent cultures. (N) Quantification of the change determined as a difference between baseline value and the maximal response in intracellular calcium released from mitochondria following exposure to CCCP (2 μM). Values represent the data from three independent cultures. Controls, n = 82 and CMT2A, n = 34. Data are expressed as box-and-whisker plots or as mean ± SEM. Statistical analysis: two-tailed unpaired Student’s t test. *P < 0.05, **P < 0.01, ***P < 0.001, and ****P < 0.0001.

