Fig. 5.
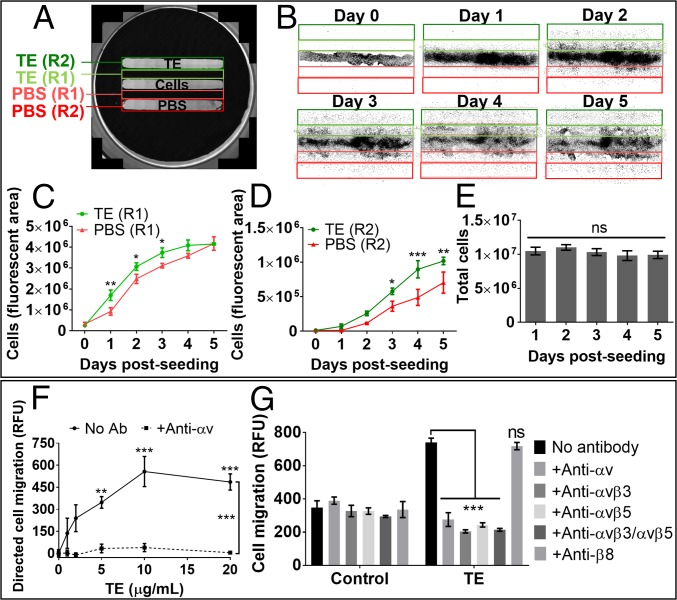
Migration of MSCs toward tropoelastin. (A) Image showing the design of the migration assay. Cells were seeded in the middle chamber equidistant from flanking chambers containing substrate-bound tropoelastin or PBS. The well surface was divided into labeled regions within which cell numbers were measured as an indication of positional cell migration. (B) Binary images of the labeled regions over 5 d, showing the spread of cell migration. Each black dot represents one cell nucleus as visualized under fluorescence microscopy. (C) Comparative cell abundance within the regions that are adjacent to the areas coated with tropoelastin or PBS. (D) Comparative cell abundance within the regions coated with tropoelastin or PBS. (E) Total cell abundance within all regions over the experimental period. (F) Cell migration toward increasing concentrations of tropoelastin as a diffusible chemoattractant in the bottom chamber of a Boyden chamber assay. Cells were incubated with or without 5 μg/mL anti-αv integrin antibody in the top chamber. Cell migration was normalized to the level of unstimulated migration exhibited by no-tropoelastin controls. Asterisks above data points represent significant differences from the no-tropoelastin control. (G) Cell chemotaxis to normal or tropoelastin-supplemented media in the presence of integrin-blocking antibodies. Controls without antibodies or with an antibody against a nonexpressed integrin (anti-β8) were included. Asterisks represent significant differences from the no-antibody control. *P < 0.05; **P < 0.01; ***P < 0.001; ns, not significant; RFU, relative fluorescence unit.

