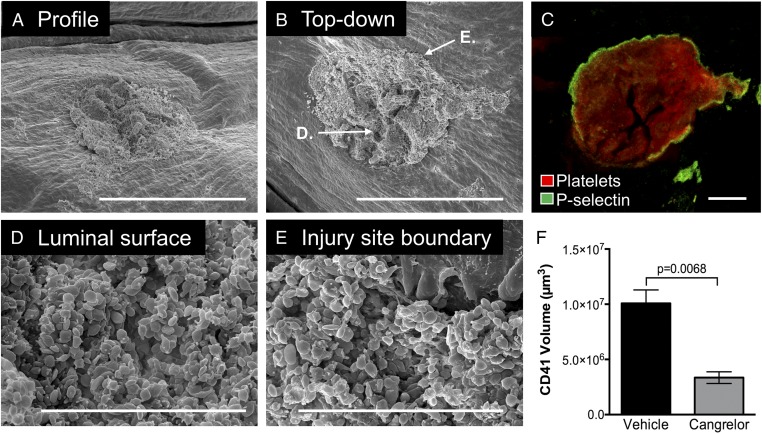
Fig. 5.
The impact of P2Y12 inhibition on intravascular hemostatic plug formation. Micrographs show a representative hemostatic plug from a cangrelor-treated mouse fixed 5 min postinjury. (A) Low-magnification SEM image of the intravascular portion of the hemostatic plug. (Scale bar: 300 µm.) The sample is tilted to provide a profile view. Note that the plug does not protrude into the vessel lumen substantially (compare with Fig. 1A). (B) The same hemostatic plug shown in A viewed from above. (Scale bar: 300 µm.) Locations of the zoomed images shown in D and E are indicated. (C) Fluorescence image of the same plug shown in A and B. The image is a maximum-intensity projection of a series of z-plane images acquired using 2-photon microscopy. (Scale bar: 100 µm.) (D and E) Higher-magnification SEM images of the regions of the hemostatic plug indicated in B. (F) Volume measurements of hemostatic plugs from vehicle- and cangrelor-treated mice. n = 5 vehicle- and 3 cangrelor-treated mice. Statistics were performed using a Student’s t test.

