Significance
Shift current is one of the bulk photovoltaic phenomena in the materials without inversion symmetry, originating from the geometric Berry phase of the constituting electron bands. This concept of photocurrent generation based on the real-space shift of the electron cloud on the short timescale of optical transition is distinct from that of conventional p–n junction photovoltaics, where the carriers are driven by the built-in Coulomb potential. We experimentally demonstrate for a ferroelectric polar semiconductor how the subpicosecond charge swing on the relevant chemical bond changes its dynamics while scanning the excitation photon energy across the bandgap. On the interband photoexcitation above the bandgap, a finite net charge flow is produced along the electrically polar direction.
Keywords: solar cells, photovoltaic effect, bulk matter, ferroelectricity, picosecond techniques
Abstract
Photoexcitation in solids brings about transitions of electrons/holes between different electronic bands. If the solid lacks an inversion symmetry, these electronic transitions support spontaneous photocurrent due to the geometric phase of the constituting electronic bands: the Berry connection. This photocurrent, termed shift current, is expected to emerge on the timescale of primary photoexcitation process. We observe ultrafast evolution of the shift current in a prototypical ferroelectric semiconductor antimony sulfur iodide (SbSI) by detecting emitted terahertz electromagnetic waves. By sweeping the excitation photon energy across the bandgap, ultrafast electron dynamics as a source of terahertz emission abruptly changes its nature, reflecting a contribution of Berry connection on interband optical transition. The shift excitation carries a net charge flow and is followed by a swing over of the electron cloud on a subpicosecond timescale. Understanding these substantive characters of the shift current with the help of first-principles calculation will pave the way for its application to ultrafast sensors and solar cells.
In the modern theory of polarization, the spontaneous electronic polarization in a crystal is formulated as the quantum phenomenon in terms of the geometric Berry phase (1, 2). The spontaneous photocurrent in the polar crystals has also been reviewed recently both in theory and in experiment. The shift current (or shift photocurrent) due to the coherent shift of electron cloud in real space is found to emerge via a difference in the Berry connection between valence and conduction bands:
| [1] |
| [2] |
where e is the elementary charge; Eexc and ωexc are the electric field and angular frequency of excitation light, respectively; is the transition matrix element; is the scattering rate, () is the energy of the valence (conduction) band, and is the Planck constant divided by 2π. Here, Rk is the gauge-independent shift vector, with being the phase of and a1 (a2) being the Berry connection of the valence (conduction) band (3, 4). Historically, the shift current has been discussed as an anomalous bulk photovoltaic/galvanic effect (5, 6) and described in several ways, including second-order nonlinear optics (7), kinetic theory (8), and Floquet formalism (3). First-principles calculations with the above formalism have successfully reproduced the experimentally observed spectral features of the shift current in actual ferroelectric materials (9). These quantum theories have clearly unveiled the shift current of geometric-phase origin, which is now extended to the cases of excitonic process (10) and spin current (11). Experimentally, the shift current has been demonstrated in various systems (12–16) and is proposed to be a major factor for realizing highly efficient solar cells (17–19). Since the shift current initiates on an interband photoexcitation, its dynamics is inherently ultrafast, which was, in fact, observed recently (20).
When charged particles run in space, they radiate electromagnetic waves. Thus, a pulsed photocurrent excited by subpicosecond lasers leads to the generation of electromagnetic waves in the terahertz-frequency range (21). This phenomenon is widely utilized for terahertz light sources by comprising photoconductive switches under the electric bias. Conversely, if we analyze the temporal/spectral dynamics of the emitted terahertz waves, it is possible to elucidate the dynamics of charges in a crystal with subpicosecond time resolution, which cannot be attained by using conventional electric circuits with electrodes. Such terahertz emission spectroscopy has become a powerful tool to study the ultrafast spontaneous photocurrent as exemplified in several semiconductors and quantum dots (22–26). There are known to be several electromagnetic wave sources in solids under pulsed photoexcitation, such as optical rectification (OR) (27) and coherent phonons (28, 29). We refer to the OR with the below-bandgap excitation as the “in-gap OR” hereafter (7).
In this study, we analyze terahertz spectra by using the procedure of a factor analysis, enabling us to resolve electron dynamics of different origins. The excitation spectrum well follows that predicted by the first-principles calculations. It is concluded that the shift current dominates the photocurrent in antimony sulfur iodide (SbSI) when excited above the bandgap, which relaxes with the time constant of ∼0.5 ps after transferring a portion of charges to the neighboring sites.
Results
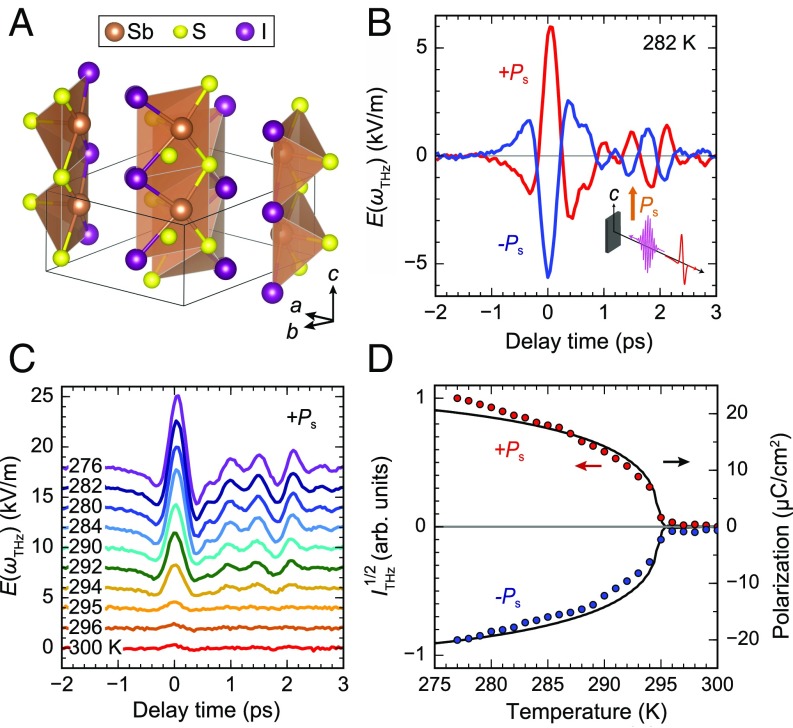
SbSI is a prototypical ferroelectric semiconductor with a bandgap of 1.9–2.0 eV and spontaneous polarization of ∼25 µC/cm2 (30, 31) proposed to be a candidate for the shift current solar cell (32). The ferroelectric polarization appears along the c axis, which is parallel to the quasi–one-dimensional structures (Fig. 1A) (33). Photovoltaic properties of SbSI have been studied intensively (31, 34, 35). Sample preparation and experimental setups are described in Materials and Methods.
Fig. 1.
Emission of terahertz waves from SbSI. (A) Crystal structure of SbSI. (B) Terahertz waves emitted from SbSI in the ferroelectric phase after ±Ps poling (±2.0 kV/cm, respectively). (C) Temperature dependence of the terahertz waveform (offset for clarity). (D) Temperature dependence of the terahertz intensity plotted together with the pyroelectric polarization. ITHz stands for the frequency integration of the power spectrum in the Fourier space, which is proportional to the square of the source current. Excitation photon energy (ℏωexc) is 2.3 eV (400 nJ), and photon polarization is .
Fig. 1B shows the representative terahertz waveforms emitted from an SbSI single crystal on pulsed photoexcitation. When the bulk polarization is reversed by an electric poling procedure, the phase of the terahertz wave is perfectly reversed, indicating the opposite current flow in the sample. The terahertz wave intensity is found to be approximately five times as large as that from a ZnTe (110) crystal, a prevailing terahertz source, measured under the similar setup. This terahertz emission can be seen only below the transition temperature (TC = 295 K) (31), and the temperature variation of its absolute amplitude ( square root of the integrated power spectrum) nearly follows that of the ferroelectric polarization (Fig. 1 C and D).
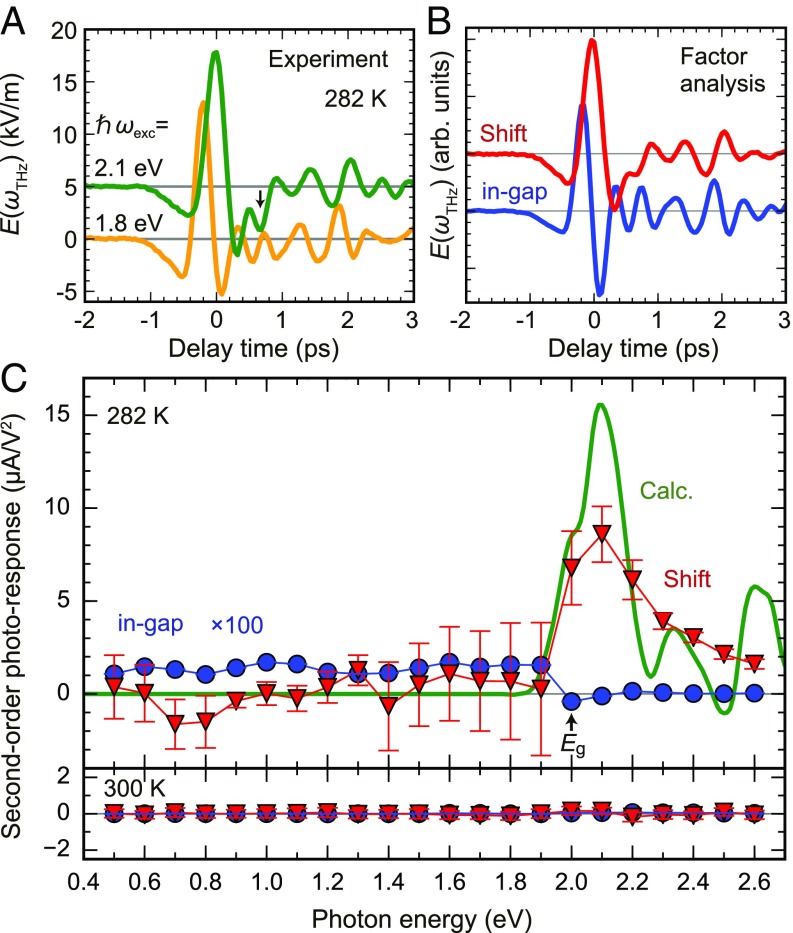
To uncover the photocarrier dynamics with and without Berry-phase contributions, we perform terahertz emission spectroscopy by scanning the excitation photon energy across the bandgap. Fig. 2A compares the terahertz waveforms excited at 2.1 and 1.8 eV, just above and below the bandgap energy of SbSI (interband and in-gap excitation, respectively).
Fig. 2.
Action spectra of the shift current deduced by the factor analysis. (A) Experimental terahertz waveforms for the excitation above and below the band gap (offset for clarity). (B) Extracted base waveforms by using the factor analysis (covariance matrix calculation) from 22 datasets. (C) Action spectra of shift current (Shift) and in-gap OR at 282 and 300 K (below and above TC, respectively). Error bars reflect the unique variance in the factor analysis, which is smaller than the marker for the case of in-gap OR. The result of the first-principles calculation is also shown. Excitation intensity is 400 nJ in the linear regime to the incident pulse energy, and photon polarization is .
It is seen that the interband excitation causes a delay of the terahertz peak (∼220 fs) from the time 0, which is accompanied by a prolonged dip in the end of the emission (extending to ∼0.5 ps) (indicated by a vertical arrow in Fig. 2A). The presence or absence of the delay in the terahertz peak appears due to the difference in the emission mechanism: the interband process, ascribed to the shift current below, follows a real transition of the electron cloud, whereas the in-gap excitation drives only a virtual one (i.e., deformation of the wave function in the valence band). Mathematically, this difference can be described by the varying order of time derivatives for each process (7). Since the in-gap OR comes from photoinduced polarization (P), while the shift current is already a charge current on excitation, the relation j = dP/dt shifts the peak between those two processes; if the main frequency of the emitted signal is around 1.0 THz (SI Appendix), the π/2-phase shift corresponding to the time derivative (or integration) leads to a 250-fs shift of the peak position.
By using the terahertz spectra measured by scanning the excitation photon energy from 0.5 to 2.6 eV (22 points), we performed a factor analysis (36). This technique was used to single out a terahertz waveform from possibly mixed signals of multiple origins, such as has been conventionally utilized in the analyses of fluorescence photoresponse spectra (37). We found that all of the spectra can be expressed by the two base waveforms shown in Fig. 2B, which can be attributed to the cases of interband excitation and in-gap OR (Fig. 2A). The corresponding photoresponse spectra, as second-order photoresponse, are shown in Fig. 2C. The absolute value is deduced by using the terahertz signals from the reference ZnTe crystal with known nonlinear optical constants (38) and by taking the effective generation length into account (SI Appendix). It is seen that the interband excitation shows a photocurrent peak around 2.10 eV, whereas the in-gap OR waveform diminishes above the bandgap. Considering the instrumental factors, the photocurrent generated by interband excitation is found to be ∼500 times larger in density compared with that of the in-gap OR. No signal was detected at 300 K (nonpolar state) (Figs. 1C and 2C, Lower), indicating that the surface contributions and other extrinsic signals can be neglected.
The experimental photocurrent spectra nearly quantitatively follow that deduced from the first-principles calculation with the Berry connection integrated (Materials and Methods), although the fine structures above 2.2 eV are somewhat smeared out in our experiment (Fig. 2C). Thus, we can ascribe the terahertz wave emission for the interband excitation to the shift current, whereas for the in-gap (virtual) one, we can ascribe it to the conventional OR. We will further discuss the reasoning for this assignment below.
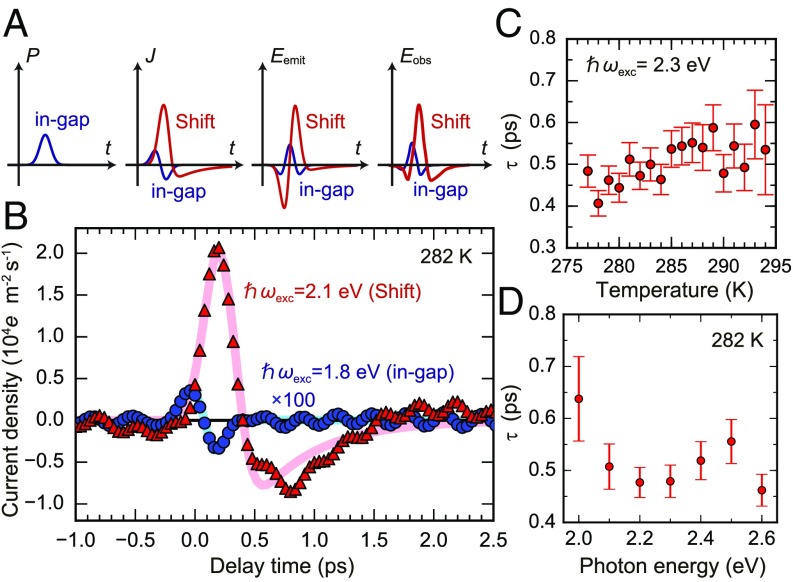
In general, in-gap optical excitation induces deformation of the wave function in polar crystals (7). Such induced polarization follows the envelope of the excitation laser pulse (Fig. 3A), with time derivative that leads to the transient charge current but not to the net flow of current (i.e., its integral over time vanishes). This current can also be a source of the terahertz emission (Fig. 2C), with the waveform following the second derivative of the nonlinear polarization. By the shift current excitation, in contrast, the electron cloud transits in real space on the primary process timescale. Subsequently, this charge shift relaxes in the absence of optical field via several scatterings and radiative/nonradiative transitions. Most importantly, a portion of charges is left in the neighboring site on this relaxation, leading to a net current flow that survives even after the integration over time. Note that the scatterings are incorporated phenomenologically as level broadening in Eq. 1, while some of the previous works emphasize only the excitation process (5, 9).
Fig. 3.
Transient nonlinear polarization and carrier dynamics. (A) Schematics of the nonlinear polarization (P), transient current (J), and emitted electric field (Eemit) for the shift current (Shift) and in-gap photoexcitation (in-gap). The detected terahertz electric fields are further modified (Eobs) due to the diffraction and instrumental factors. (B) Retrieved current dynamics for the shift current and in-gap photoexcitation. Solid lines represent the fitting curves. Shift current accompanies a swing over (relaxation) of the charge with a decay time of ∼0.5 ps, whereas the in-gap photoexcitation appears only within the incident pulse duration. (C and D) Temperature and incident photon energy dependence of the decay time . Excitation intensity is 400 nJ, and photon polarization is .
The respective carrier dynamics discussed above can be visualized by integrating the terahertz waveforms. The experimentally obtained carrier dynamics was fitted by
| [3] |
where the first part represents the incident laser pulse ( 55 fs for the case of our 130-fs incident Gaussian laser pulse), is the delta function, and is the step function (20). Fig. 3B illustrates the retrieved transient current. The in-gap OR shows the waveform to be a derivative of the incident laser envelope (approximately of Gaussian form). In stark contrast, the shift current appears with some delay and with a slow relaxation (swing over) and carries the net current. The decay (scattering) time τ was found to be ∼0.5 ps for SbSI by following Eq. 3. This decay time is found to be nearly independent of temperature and incident photon energy, except for the case near the bandgap energy (Fig. 3D); thus, the impurity can be the source of scattering.
In materials without inversion symmetry, there can be another mechanism generating spontaneous photocurrent. The so-called ballistic current appears due to the asymmetric excited population in the momentum space through the photoexcitation accompanied by asymmetric phonon scatterings (6, 39–41). We ascribe our observation predominantly to the shift current from the following observations; the experimental photoresponse spectrum is quantitatively comparable with that from theory (Fig. 2C), and the decay time (∼0.5 ps) is insensitive to the sample temperature (Fig. 3C). Thus, the phonon-assisted asymmetric population process seems irrelevant in this case. We note that our previous study (35) also points to the existence of shift current in SbSI by showing that the pulsed photocurrent in SbSI appears constantly at low temperatures. The intrinsic delay in the photocurrent peak compared with the in-gap OR (Fig. 3 A and B) is also consistent with the profile based on the simple analytical model (7).
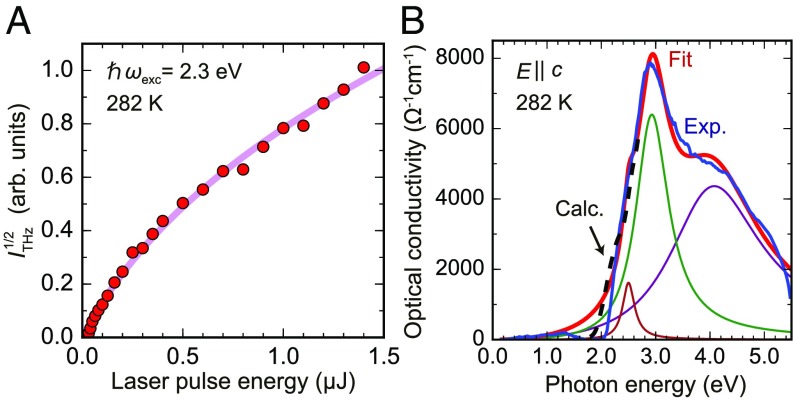
Eq. 1 indicates that the shift current shows a specific incident power () dependence. Fig. 4A displays the corresponding experiment. The fitting to Eq. 1 yields to be ∼2.9 × 10⁴ m/s for the scattering time τ of 0.5 ps. Fig. 4B represents the optical conductivity spectrum of SbSI at 282 K. We used a multiple-dipole model to analyze this spectrum (42), which is also compared with the theoretical calculation (Materials and Methods). The transition matrix element at 2.3 eV averaged by three peaks is estimated to be . This is very close to the value evaluated above from the incident power dependence. Note that a sublinear incident power dependence has also been reported for GaAs (110) (43).
Fig. 4.
Incident laser power dependence of terahertz emission and linear optical conductivity. (A) Terahertz absolute amplitude () showing sublinear incident power dependence. The solid line is a fit by Eq. 1. Photon polarization is . (B) Linear optical conductivity plotted together with the first-principles data (dashed curve; up to 2.7 eV) and fitting curves.
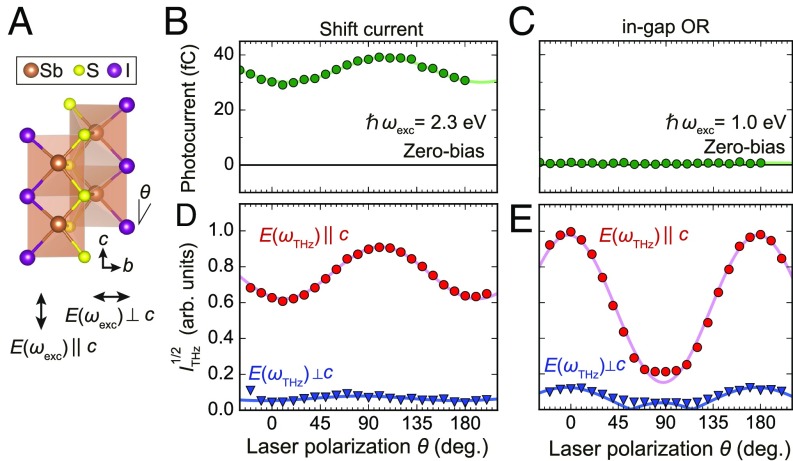
Lastly, we demonstrate the incident polarization dependence. Fig. 5 compares the polarimetry of zero-bias photocurrent evaluated by using a conventional electric circuit (35) with that of the terahertz emission. The anisotropy can be discussed by following the motion of electron cloud on the chemical bonds (Fig. 5A). With the interband excitation at photon energy () of 2.3 eV (Fig. 5B), a finite shift current along the c axis runs into the electrodes. Both the zero-bias photocurrent and terahertz emission show sinusoidal polarization dependence with a maximum near 90° (Fig. 5 B and D), which is consistent with the previous reports (31). In contrast, the zero-bias photocurrent is absent for the in-gap excitation with = 1.0 eV (Fig. 5C). The terahertz emission for this case shows distinct polarization dependence with a maximum near 0°. The terahertz emission perpendicular to the c axis [] is found to be small for both cases of excitation. The SbSI belongs to the C2v (mm2) point group in the ferroelectric phase, with the second-order photoconductivity [] tensors of the form
| [4] |
The nonlinear optical tensor [] has the same symmetry. By fitting (Fig. 5 D and E), we can estimate the effective tensor elements to be , for the in-gap excitation (in-gap OR; = 1.0 eV) and , for the interband excitation (shift current; = 2.3 eV). Here, each tensor element includes Fresnel factors, and we set for simplicity. We speculate that the observed enhancement of [] in the shift current is related to the electron transition between S and I sites and that between S and Sb sites (Fig. 5A) (44).
Fig. 5.
Polarimetry of shift current and in-gap OR. (A) Schematic illustration of the connected polyhedra and definition of angle θ. (B and C) Incident polarization dependence of the pulsed zero-bias photocurrent with excitation photon energy above and below the bandgap, respectively, measured by a transimpedance amplifier through the electrodes at 282 K. The zero degree corresponds to the polarization parallel to the c axis. (D and E) Corresponding amplitude spectra of the emitted terahertz wave (). The wire-grid analyzer is fixed at or , and incident laser polarization is rotated from . Solid lines represent the fittings considering the symmetry-allowed tensor elements (Eq. 4).
Conclusion
By analyzing the terahertz electromagnetic spectra radiated from the photo-induced charge dynamics, we have uncovered the ultrafast shift current, including its relaxation. The intriguing characteristics of the shift current, reflecting the Berry-phase contributions in the electronic process, were traced with photoexcitation under varying temperature, poling, excitation photon energy, and photon polarization conditions. It is found that the subpicosecond photocurrent shows a distinct transition from the in-gap OR to the shift excitation in their time profile when the excitation photon energy is crossing the bandgap; only the latter carries a net current to the electrodes. The shift current spectrum is found to be consistent with the band calculation incorporating the Berry connection. Understanding these features of the shift current would materialize dissipationless ultrafast electronic devices.
Materials and Methods
Single crystals of SbSI were grown by a physical vapor transport technique in an evacuated quartz tube. The typical sample size was 5 mm (length) × 0.5 mm (width) × 0.4 mm (thickness), with the crystal c axis parallel to the longest orientation. Silver electrodes were attached along the c axis with ∼2-mm separation. The spot size of the excitation laser, penetration depth of the light above the bandgap, and coherence length of the terahertz emission are much smaller than the sample size.
The terahertz emission from SbSI single crystals was measured in reflection geometry using a variable-wavelength laser (130 fs, 1 kHz, spot size ∼ 70 µm in diameter) for excitation. A ZnTe (110) crystal (500-μm thickness) was used for the electrooptic sampling to analyze the terahertz waveform. The samples were mounted on a Peltier stage and poled before each measurement by cooling through the transition temperature under the external electric field. A reference ZnTe (110) crystal was mounted next to the sample to evaluate the time 0 and instrumental functions of the terahertz waveform measurements.
The band structure of SbSI was calculated on the basis of the density-functional theory with the localized atomic orbital basis and the full potential as implemented in the full-potential local orbital code (45). The exchange correlation functions were considered at the generalized gradient approximation level (46). By projecting the wave function in atomic basis into a reduced symmetric atomic orbital, like Wannier functions (Sb-p, S-p and I-s, p orbitals), we constructed tight-binding Hamiltonians with 96 bands and computed the shift current response. The obtained second-order photoresponse spectrum was shifted in energy (∼0.09 eV) due to the underestimation of the bandgap and convoluted with the experimental incident laser bandwidth (Fig. 2C). Note that there are several uncertainties in the comparison between the theoretical and experimental spectra; the ferroelectric polarization is not fully developed in the experiment at 282 K, and the scattering is not included in the original shift current formalism. It is reported, however, that the scattering does not substantially affect the generation of shift current (47, 48). In Fig. 2C, the experimental spectra were deduced from the peak amplitude of the terahertz wave (such as that in Fig. 1B) by following ref. 23.
Linear optical conductivity was derived by Kramers–Kronig transformation of the reflectance spectrum. We used dipole model (42)
| [5] |
where is the angular frequency of incident photon; is the scattering rate; and are the index of the excited and ground states, respectively; and are the optical polarization; and is the group velocity matrix elements. For the corresponding data from the first-principles calculation, the optical conductivity was limited to 2.7 eV due to the numerical instability.
Direct photocurrent under light pulse (130-fs, 1-kHz) excitation was measured by using a transimpedance amplifier (bandwidth of 200 MHz). The signal was averaged 150 times with a digitizing oscilloscope.
Supplementary Material
Acknowledgments
We thank D. Maryenko and W. Koshibae for stimulating discussions. This research is supported by Japan Society for the Promotion of Science (JSPS) KAKENHI Grants 18K14155, 24224009, 16H00981, and 17H02914. M.N., J.F. and N.O. are supported by PRESTO, Japan Science and Technology Agency Grants JPMJPR16R5 (to M.N.), JPMJPR15R5 (to J.F.), and JPMJPR17I3 (to N.O.). T.M. was supported by the Gordon and Betty Moore Foundation’s EPiQS Initiative Theory Center Grant (to University of California, Berkeley), and the Quantum Materials program at Lawrence Berkeley National Laboratory (LBNL) funded by the US Department of Energy under Contract DE-AC02-05CH11231. Y.Z. is supported by German Research Foundation Grant SFB 1143. N.N. is supported by JST CREST Grant JPMJCR16F1, Japan, and JSPS KAKENHI Grants 18H03676 and 26103001.
Footnotes
The authors declare no conflict of interest.
This article is a PNAS Direct Submission.
This article contains supporting information online at www.pnas.org/lookup/suppl/doi:10.1073/pnas.1802427116/-/DCSupplemental.
References
- 1.Resta R, Vanderbilt D. 2007. Theory of polarization: A modern approach. Physics of Ferroelectrics, Topics in Applied Physics (Springer, Berlin), Vol 105, pp 31–68.
- 2.Resta R. Electrical polarization and orbital magnetization: The modern theories. J Phys Condens Matter. 2010;22:123201. doi: 10.1088/0953-8984/22/12/123201. [DOI] [PubMed] [Google Scholar]
- 3.Morimoto T, Nagaosa N. Topological nature of nonlinear optical effects in solids. Sci Adv. 2016;2:e1501524. doi: 10.1126/sciadv.1501524. [DOI] [PMC free article] [PubMed] [Google Scholar]
- 4.Morimoto T, Nagaosa N. 2018. Current-voltage characteristics and shot noise of shift current photovoltaics. arXiv:1805.09908v1.
- 5.von Baltz R, Kraut W. Theory of the bulk photovoltaic effect in pure crystals. Phys Rev B Condens Matter. 1981;23:5590–5596. [Google Scholar]
- 6.Sturman BI, Fridkin VM. The Photovoltaic and Photorefractive Effects in Noncentrosymmetric Materials. Gordon and Breach Science Publishers; Philadelphia: 1992. [Google Scholar]
- 7.Sipe JE, Shkrebtii AI. Second-order optical response in semiconductors. Phys Rev B Condens Matter Mater Phys. 2000;61:5337–5352. [Google Scholar]
- 8.Král P. Quantum kinetic theory of shift-current electron pumping in semiconductors. J Phys Condens Matter. 2000;12:4851–4868. [Google Scholar]
- 9.Young SM, Rappe AM. First principles calculation of the shift current photovoltaic effect in ferroelectrics. Phys Rev Lett. 2012;109:116601. doi: 10.1103/PhysRevLett.109.116601. [DOI] [PubMed] [Google Scholar]
- 10.Morimoto T, Nagaosa N. Topological aspects of nonlinear excitonic processes in noncentrosymmetric crystals. Phys Rev B. 2016;94:035117. [Google Scholar]
- 11.Kim KW, Morimoto T, Nagaosa N. Shift charge and spin photocurrents in Dirac surface states of topological insulator. Phys Rev B. 2017;95:035134. [Google Scholar]
- 12.Koch WTH, Munser R, Ruppel W, Würfel P. Anomalous photovoltage in BaTiO3. Ferroelectrics. 1976;13:305–307. [Google Scholar]
- 13.Yang SY, et al. Photovoltaic effects in BiFeO3. Appl Phys Lett. 2009;95:062909. [Google Scholar]
- 14.Nakamura M, et al. Spontaneous polarization and bulk photovoltaic effect driven by polar discontinuity in LaFeO3/SrTiO3 heterojunctions. Phys Rev Lett. 2016;116:156801. doi: 10.1103/PhysRevLett.116.156801. [DOI] [PubMed] [Google Scholar]
- 15.Kushnir K, Wang M, Fitzgerald D, Koski KJ, Titova LV. Ultrafast zero-bias photocurrent in GeS nanosheets: Promise for photovoltaics. ACS Energy Lett. 2017;2:1429–1434. [Google Scholar]
- 16.Nakamura M, et al. Shift current photovoltaic effect in a ferroelectric charge-transfer complex. Nat Commun. 2017;8:281. doi: 10.1038/s41467-017-00250-y. [DOI] [PMC free article] [PubMed] [Google Scholar]
- 17.Tan LZ, Zheng F, Young SM, Wang F, Rappe AM. Shift current bulk photovoltaic effect in polar materials–Hybrid and oxide perovskites and beyond. Npj Comput Mater. 2016;2:16026. [Google Scholar]
- 18.Cook AM, M Fregoso B, de Juan F, Coh S, Moore JE. Design principles for shift current photovoltaics. Nat Commun. 2017;8:14176. doi: 10.1038/ncomms14176. [DOI] [PMC free article] [PubMed] [Google Scholar]
- 19.Butler KT, Frost JM, Walsh A. Ferroelectric materials for solar energy conversion: Photoferroics revisited. Energy Environ Sci. 2015;8:838–848. [Google Scholar]
- 20.Braun L, et al. Ultrafast photocurrents at the surface of the three-dimensional topological insulator Bi2Se3. Nat Commun. 2016;7:13259. doi: 10.1038/ncomms13259. [DOI] [PMC free article] [PubMed] [Google Scholar]
- 21.Zhang XC, Hu BB, Auston DH. Generation of femtosecond electromagnetic pulses from semiconductor surfaces. Appl Phys Lett. 1990;56:1011–1013. [Google Scholar]
- 22.Son JH, Norris TB, Whitaker JF. Terahertz electromagnetic pulses as probes for transient velocity overshoot in GaAs and Si. J Opt Soc Am B. 1994;11:2519–2527. [Google Scholar]
- 23.Laman N, Bieler M, van Driel HM. Ultrafast shift and injection currents observed in wurtzite semiconductors via emitted terahertz radiation. J Appl Phys. 2005;98:103507. [Google Scholar]
- 24.Mics Z, et al. Charge transport and localization in nanocrystalline CdS films: A time-resolved terahertz spectroscopy study. Phys Rev B Condens Matter Mater Phys. 2011;83:155326. [Google Scholar]
- 25.Zhang XC, Jin Y, Ma XF. Coherent measurement of THz optical rectification from electro‐optic crystals. Appl Phys Lett. 1992;61:2764–2766. [Google Scholar]
- 26.Côté D, Laman N, Van Driel HM. Rectification and shift currents in GaAs. Appl Phys Lett. 2002;80:905–907. [Google Scholar]
- 27.Nastos F, Sipe JE. Optical rectification and shift currents in GaAs and GaP response: Below and above the band gap. Phys Rev B Condens Matter Mater Phys. 2006;74:035201. [Google Scholar]
- 28.Dekorsy T, Auer H, Bakker HJ, Roskos HG, Kurz H. THz electromagnetic emission by coherent infrared-active phonons. Phys Rev B Condens Matter. 1996;53:4005–4014. doi: 10.1103/physrevb.53.4005. [DOI] [PubMed] [Google Scholar]
- 29.Sotome M, Kida N, Takeda R, Okamoto H. Terahertz radiation induced by coherent phonon generation via impulsive stimulated Raman scattering in paratellurite. Phys Rev A. 2014;90:033842. [Google Scholar]
- 30.Fatuzzo E, et al. Ferroelectricity in SbSI. Phys Rev. 1962;127:2036–2017. [Google Scholar]
- 31.Fridkin VM. Photoferroelectrics. Springer-Verlag; New York: 1979. [Google Scholar]
- 32.Butler KT, et al. Quasi-particle electronic band structure and alignment of the V-VI-VII semiconductors SbSI, SbSBr, and SbSeI for solar cells. Appl Phys Lett. 2016;108:112103. [Google Scholar]
- 33.Momma K, Izumi F. VESTA 3 for three-dimensional visualization of crystal, volumetric and morphology data. J Appl Crystallogr. 2011;44:1272–1276. [Google Scholar]
- 34.Fridkin VM, Rodin AI. Anomalous photovoltaic effect in ferroelectric SbSI and cubic piezoelectric ZnS. Phys Status Solidi. 1980;61:123–126. [Google Scholar]
- 35.Ogawa N, Sotome M, Kaneko Y, Ogino M, Tokura Y. Shift current in the ferroelectric semiconductor SbSI. Phys Rev B. 2017;96:241203. doi: 10.1073/pnas.1802427116. [DOI] [PMC free article] [PubMed] [Google Scholar]
- 36.Bishop CM. Pattern Recognition and Machine Learning. Springer-Verlag; New York: 2006. [Google Scholar]
- 37.Stedmon CA, Bro R. Characterizing dissolved organic matter fluorescence with parallel factor analysis: A tutorial. Limnol Oceanogr Methods. 2008;6:572–579. [Google Scholar]
- 38.Wu Q, Zhang XC. Ultrafast electro-optic field sensors. Appl Phys Lett. 1996;68:1604–1606. [Google Scholar]
- 39.Belinicher VI, Sturman BI. The photogalvanic effect in media lacking a center of symmetry. Phys Usp. 1980;23:199–223. [Google Scholar]
- 40.Belinicher VI, Ivchenko EL, Sturman BI. Kinetic theory of the displacement photovoltaic effect in piezoelectrics. Zh Eksp Teor Fiz. 1982;83:649–661. [Google Scholar]
- 41.Belinicher VI, Sturman BI. The relation between shift and ballistic currents in the theory of photogalvanic effect. Ferroelectrics. 1988;83:29–34. [Google Scholar]
- 42.Dresselhaus MS. 2001. Solid State Physics, Part II: Optical Properties of Solids, Lecture Notes (Massachusetts Institute of Technology, Cambridge, MA), p 17.
- 43.Bieler M, Pierz K, Siegner U, Dawson P. Simultaneous generation of shift and injection currents in (110)-grown GaAs/AlGaAs quantum wells. J Appl Phys. 2006;100:083710. [Google Scholar]
- 44.Amoroso D, Picozzi S. Ab initio approach to structural, electronic, and ferroelectric properties of antimony sulphoiodide. Phys Rev B. 2016;93:214106. [Google Scholar]
- 45.Koepernik K, Eschrig H. Full-potential nonorthogonal local-orbital minimum-basis band-structure scheme. Phys Rev B Condens Matter Mater Phys. 1999;59:1743–1757. [Google Scholar]
- 46.Perdew JP, Burke K, Ernzerhof M. Generalized gradient approximation made simple. Phys Rev Lett. 1996;77:3865–3868. doi: 10.1103/PhysRevLett.77.3865. [DOI] [PubMed] [Google Scholar]
- 47.Zhang Y, et al. Photogalvanic effect in Weyl semimetals from first principles. Phys Rev B. 2018;97:241118. [Google Scholar]
- 48.Gong S-J, Zheng F, Rappe AM. Phonon influence on bulk photovoltaic effect in the ferroelectric semiconductor GeTe. Phys Rev Lett. 2018;121:017402. doi: 10.1103/PhysRevLett.121.017402. [DOI] [PubMed] [Google Scholar]
Associated Data
This section collects any data citations, data availability statements, or supplementary materials included in this article.


