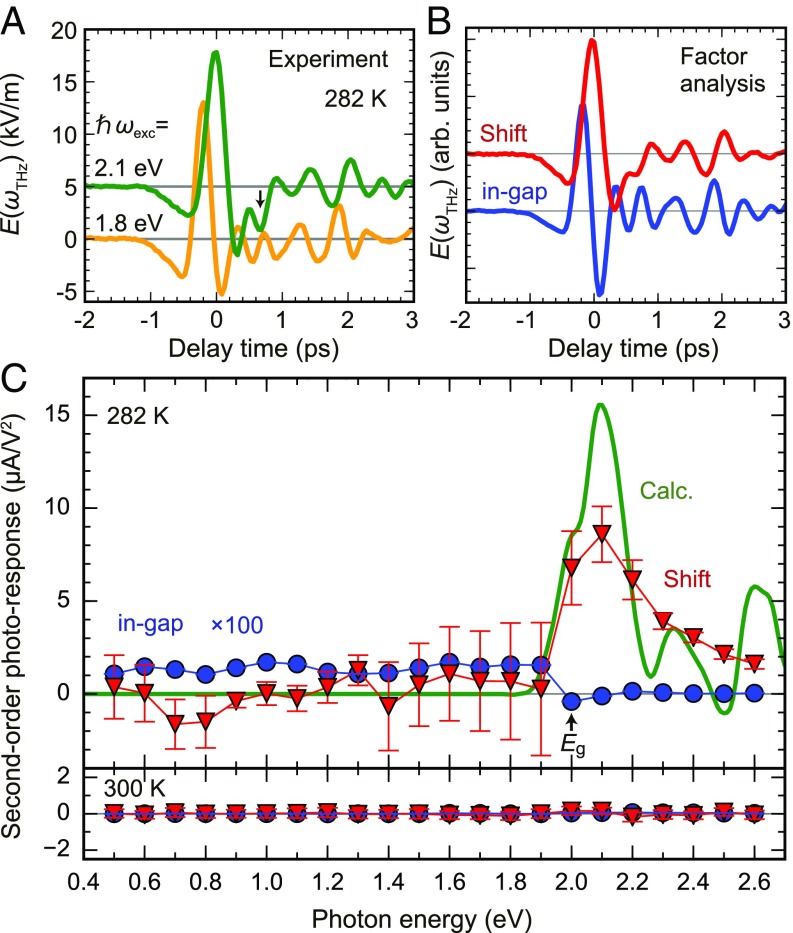
Fig. 2.
Action spectra of the shift current deduced by the factor analysis. (A) Experimental terahertz waveforms for the excitation above and below the band gap (offset for clarity). (B) Extracted base waveforms by using the factor analysis (covariance matrix calculation) from 22 datasets. (C) Action spectra of shift current (Shift) and in-gap OR at 282 and 300 K (below and above TC, respectively). Error bars reflect the unique variance in the factor analysis, which is smaller than the marker for the case of in-gap OR. The result of the first-principles calculation is also shown. Excitation intensity is 400 nJ in the linear regime to the incident pulse energy, and photon polarization is .

