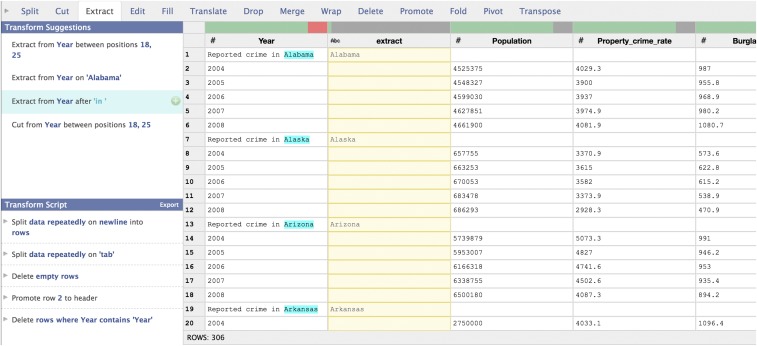
Fig. 3.
The Data Wrangler interface for data cleaning and transformation, including a table grid (Right) and a transcript of executed transforms (Lower Left). Here, a user simply selects the text “Alabama” in the first row. The system responds with automatic transform suggestions (Left), such as extracting or cutting text from table cells. The selected transform extracts text after the span “in.” Visual previews in the table grid visualize the effect of applying the transform.

