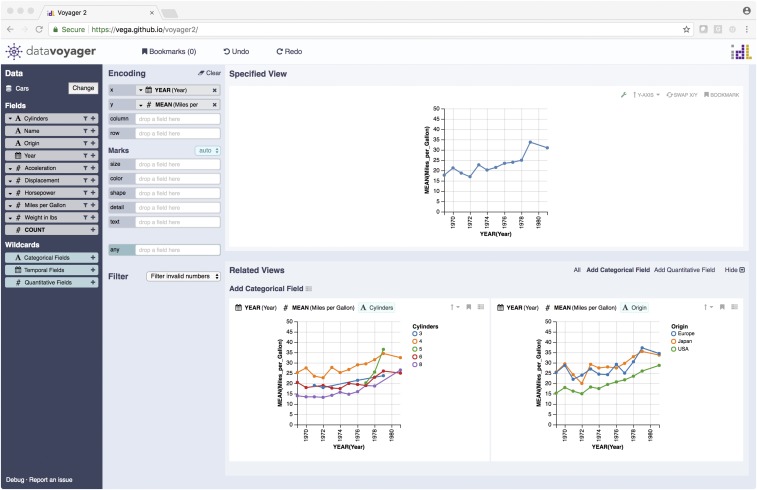
Fig. 4.
The Voyager system for exploratory visual analysis. Here, an analyst views a chart showing the average fuel efficiency of cars over multiple years (Upper). The system automatically searches over the space of visualizations to suggest related views (Lower), such as subdividing the data by a categorical field (cylinder count or region of origin) to provide additional insight.

