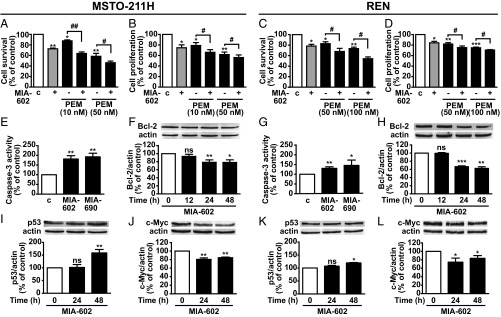
Fig. 2.
Inhibitory effects of GHRH antagonists in MPM cells. Cell survival (A and C) and proliferation (B and D) assessed by MTT and BrdU assays, respectively, in MSTO-211H and REN cells untreated or treated for 72 h in medium with 2.5% serum (c, control medium) with 1 μM MIA-602, alone or with PEM, at the concentrations indicated. Results, expressed as percent of control, are mean ± SEM. *P < 0.05, **P < 0.01, and ***P < 0.001 vs. c; #P < 0.05, ##P < 0.01; n = 4. Caspase-3 activity in MSTO-211H (E) and REN cells (G) treated for 24 h with 1 µM MIA-602 or MIA-690. Results, expressed as percent of control are mean ± SEM. *P < 0.05 and **P < 0.01 vs. control; n = 3. Representative Western blot for Bcl-2 (F and H), p53 (I and K), and c-Myc (J and L) in cells treated with 1 µM MIA-602 or MIA-690 for the indicated times. Results, normalized to actin and expressed as percent of control (Time 0), are mean ± SEM. *P < 0.05, **P < 0.01, ***P < 0.001; n = 3. ns, not significant.

