Fig. 3.
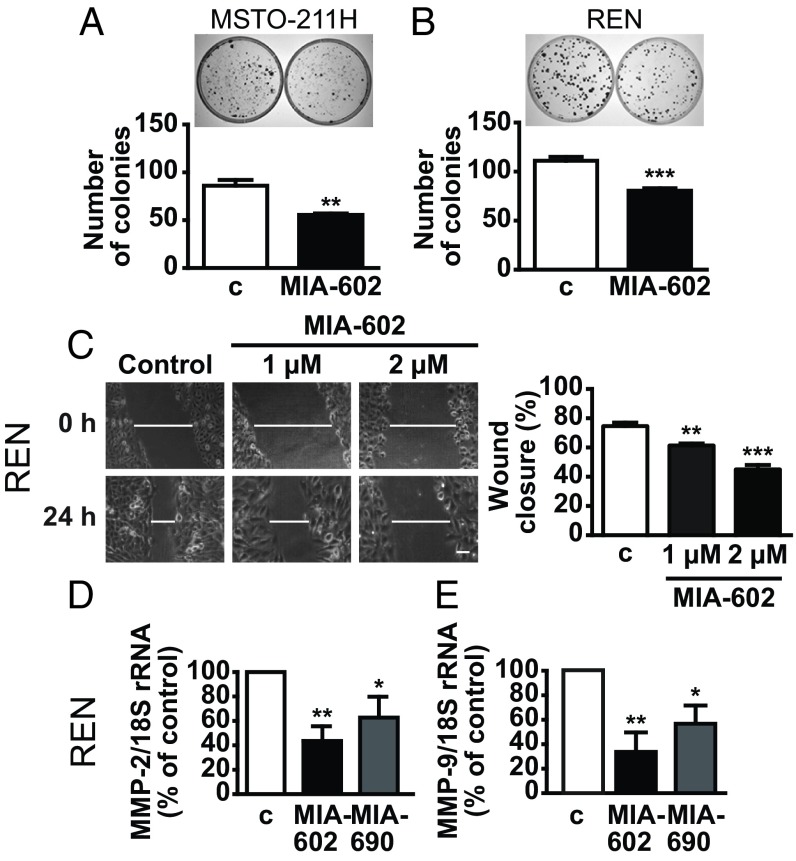
Inhibitory effects of GHRH antagonists on cell growth and migration. Representative colony formation in MSTO-211H (A) and REN (B) cells untreated (c, control) or treated for 10 d with 1 μM MIA-602. Results are mean ± SEM. **P < 0.01 and ***P < 0.001 vs. c; n = 3. (C) Representative images of wound-healing assay in REN cells cultured in medium with 2.5% serum and treated for 24 h with MIA-602 at the indicated concentrations. (Scale bar: 20 μM.) Histogram (Right) shows the wound closure efficiency. Results, expressed as percent of control, are mean ± SEM. **P < 0.01 and ***P < 0.001 vs. c; n = 3. Real-time PCR for MMP-2 (D) and MMP-9 (E) mRNA expression normalized to 18S rRNA in REN cells treated for 24 h with 1 μM MIA-602 or MIA-690. Results, expressed as fold change of control, are mean ± SEM. *P < 0.05 and **P < 0.01 vs. c; n = 3.

