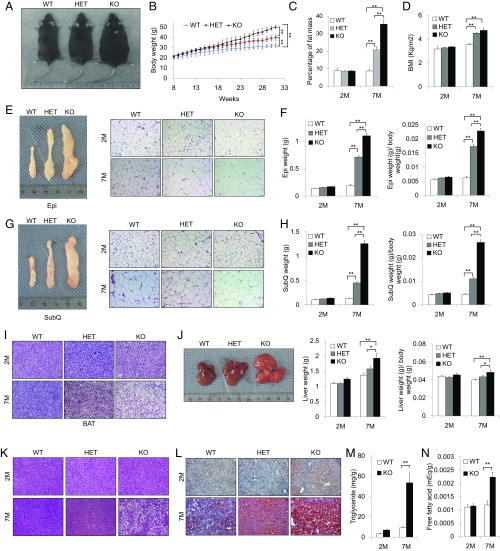
Fig. 1.
Kdm4b KO mice exhibit obesity phenotypes on normal chow diet. (A) Representative images of male 7-mo-old WT, HET, and KO mice. (B) Growth curve of WT, HET, and KO littermates (n = 8). (C) Determination of percentage of fat mass of WT, HET, and KO mice using NMR imaging at 2 mo and 7 mo (n = 8). (D) Determination of BMI of WT, HET and KO mice starting at 28 d for 2-mo-old and 7-mo-old mice (n = 8). (E) Representative images of Epi WAT from WT, HET, and KO mice at 7 mo and H&E staining of Epi from WT, HET, and KO mice. (Scale bars, 50 µm.) (F) Determination of Epi weights from WT, HET, and KO mice at 2 and 7 mo (n = 8). (G) Representative images of SubQ WAT from WT, HET, and KO mice at 7 mo and H&E staining of SubQ from WT, HET, and KO mice at 2 and 7 mo. (Scale bars, 50 µm.) (H) Determination of SubQ from WT, HET, and KO mice at 2 and 7 mo (n = 8). (I) H&E staining of BAT for WT, HET, and KO mice at 2 and 7 mo. (Scale bars, 50 µm.) (J) Representative images of livers of WT, HET, and KO mice at 7 mo, and determination of liver weights (n = 8). (K) H&E staining of livers for WT, HET, and KO mice at 2 and 7 mo. (Scale bars, 50 µm.) (L) Oil Red O staining of livers for WT, HET, and KO mice at 2 and 7 mo. (Scale bars, 50 µm.) (M and N) Determination of percentage triglyceride (M) and free fatty acids (N) in liver tissues of WT and KO mice (n = 6). *P < 0.05; **P < 0.01. All data are presented as the mean ± SEM.

