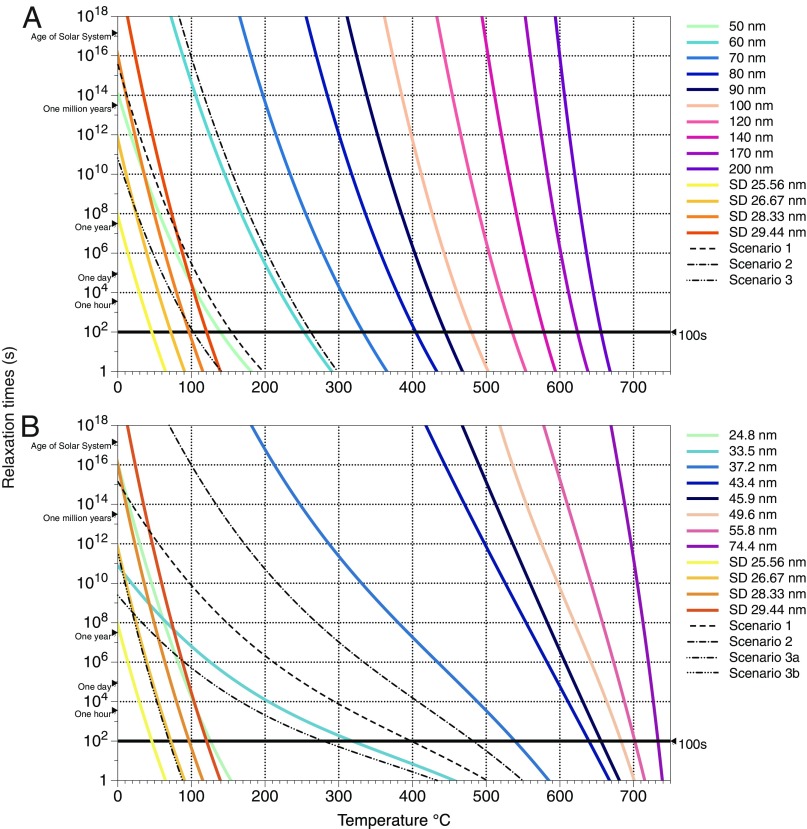
Fig. 2.
(A and B) Pullaiah curves for small spherical (A) and cubic (B) grains of iron through the SD and SV grain size range that shows the relationship between the temporal and thermal stabilities of magnetization. Heating a sample and noting the temperature at which it loses its magnetization can therefore tell us the age of remanence acquisition. In B the sizes are ESVD. The dashed lines are the interpolated Pullaiah curves (using Eq. 8) that determine the blocking temperatures and maximum affected grain sizes for the remagnetization scenarios listed in Table 1.

