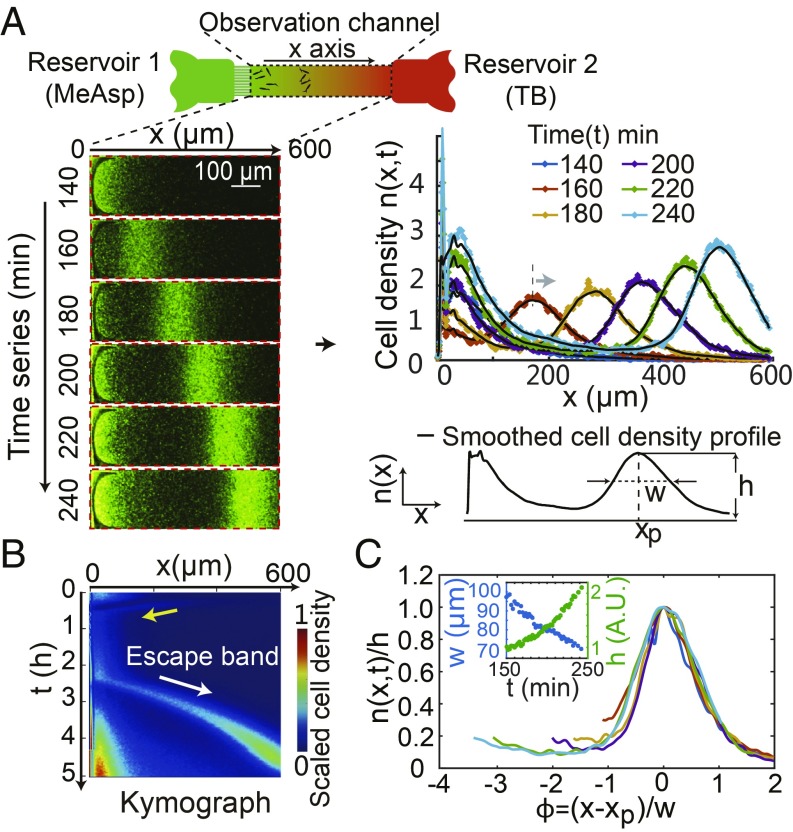
Fig. 1.
The traveling escape band in a microfluidic channel with opposing gradients. (A) Schematic diagram of the microfluidic device (15). Reservoir 1 (green) contains 2 mM MeAsp. Reservoir 2 (red) contains TB and bacteria. (A, Left) Images of cell density in the channel at different times show the formation of the escape band traveling toward reservoir 2. (A, Right) The cell-density profiles along the length of the channel (x axis) at different times. The cell-density profile is characterized by its peak , width , and peak location . (B) The kymograph showing the spatiotemporal dynamics of the cell-density profile. The initial wave approaching reservoir 1 and the escape band formed later are highlighted by the yellow and white arrows, respectively. (C) The rescaled escape-band profiles at different times collapse onto a single curve. C, Inset shows the dependence of peak width and the height on time (t).

