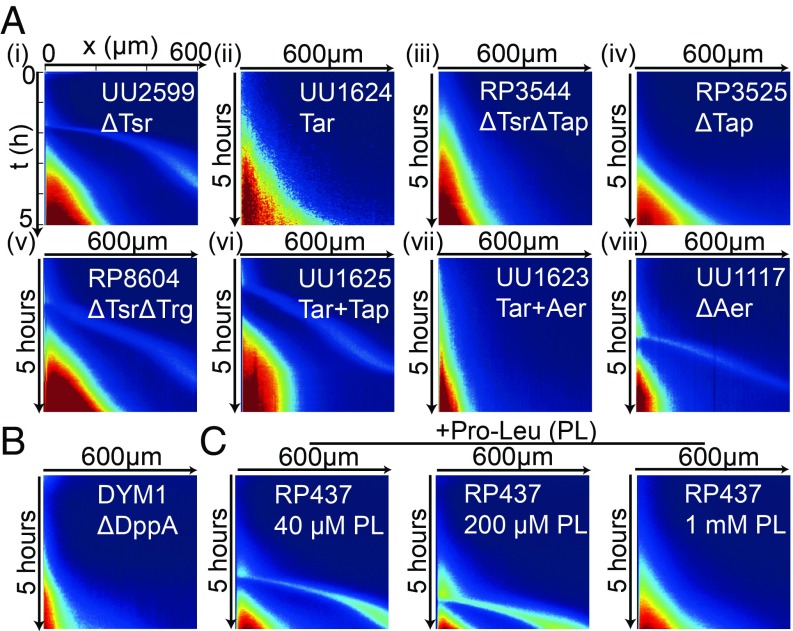
Fig. 3.
Spatiotemporal cell density profile (kymograph) for mutants and WT under different nutrient conditions. (A) Kymograph for different mutant strains. (A, i) . (A, ii) ( only). (A, iii) . (A, iv) . (A, v) . (A, vi) . (A, vii) . (A, viii) . (B) Kymograph for strain DYM1 () shows no escape band. (C) Kymograph for WT () with different dipeptide Pro-Leu concentrations added to TB. The escape band is absent for Pro-Leu.

