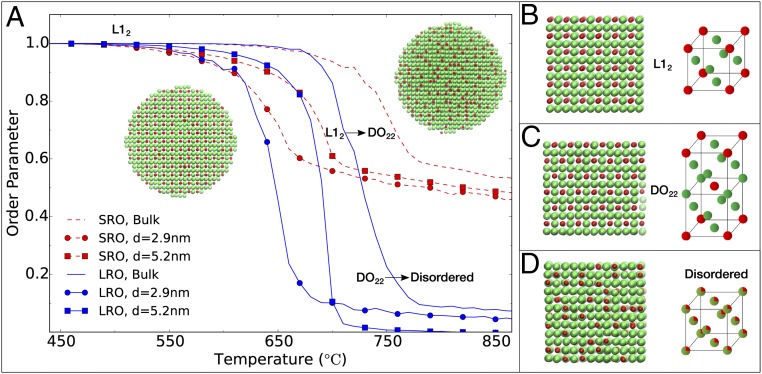
Fig. 3.
(A) Simulation results for the SROP (red, dashed line) and LROP (blue, solid line) as a function of temperature for bulk (n = 864; no marker) and spherical NPs with diameter (d) = 2.9 nm (n = 800; circles) and d = 5.2 nm (n = 4,800; squares), with snapshots shown at temperatures just before the ODT on the left and just after the ODT on the right. The temperatures are rigidly shifted so as to match the simulation results to the experimental bulk ODT temperature. As the size of the NP is reduced, the ODT temperature for the NPs also decreases. (B–D) Snapshots of the bulk trajectory taken at increasing temperatures showing ordered intermetallic phase, L12 (B), D022 state with global long-range order and lower crystal symmetry (C), and disordered solid solution phase (D). The green and red atoms represent Pt and Co, respectively.

