Fig. 5.
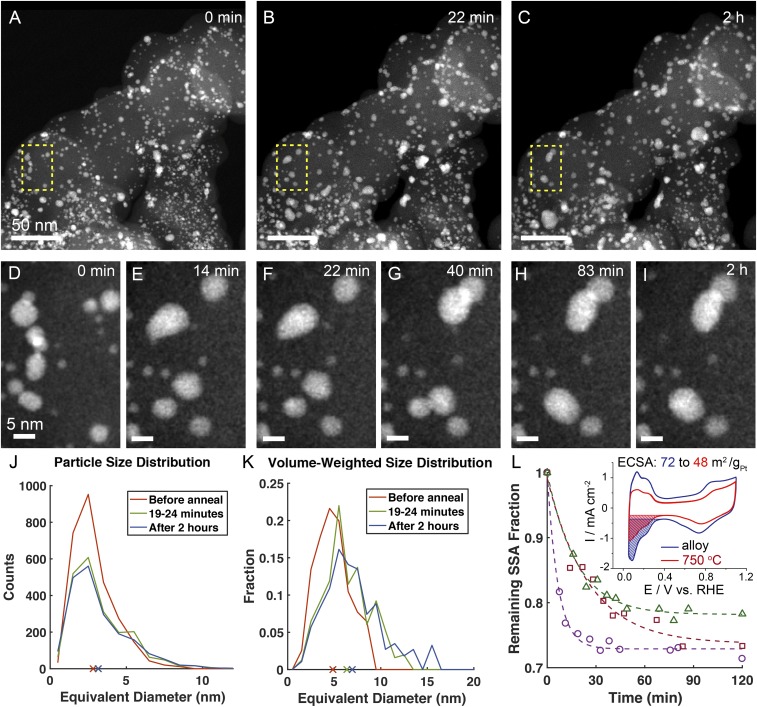
In situ heating STEM enabling tracking of the morphological changes of Pt3Co/C annealed at 750 °C. (A–C) Pt3Co/C before annealing (A), annealed for 22 min (B), and annealed for 2 h (C), respectively. (D–I) A specific region was magnified to illustrate particle migration and coalescence during a continuous 2-h annealing process. (J) Measured distribution of particle sizes of thousands of particles from Fig. 4A at different annealing times at 750 °C. Cross marks on the x axis represent the corresponding average particle sizes. (K) Volume-weighted, particle size distribution, which reflects the relative contribution of larger particles more clearly, as shown by the more pronounced tails for particle sizes above 8 nm. Cross marks on the x axis represent the corresponding volume-weighted, average particle sizes. (L) SSA (m2/gPt) estimated from STEM images of three different regions at different annealing times. (L, Inset) ECSA for Pt3Co/C before and after annealing at 750 °C for 2 h, measured from the coulometric charge associate with hydrogen adsorption (Hads) regions in the cyclic voltammograms. Details of statistical analysis of particle sizes and SSA calculations can be found in the experimental section. (Scale bars: A–C, 50 nm; D–I, 5 nm.) Dynamic changes can be found in Movie S2.

