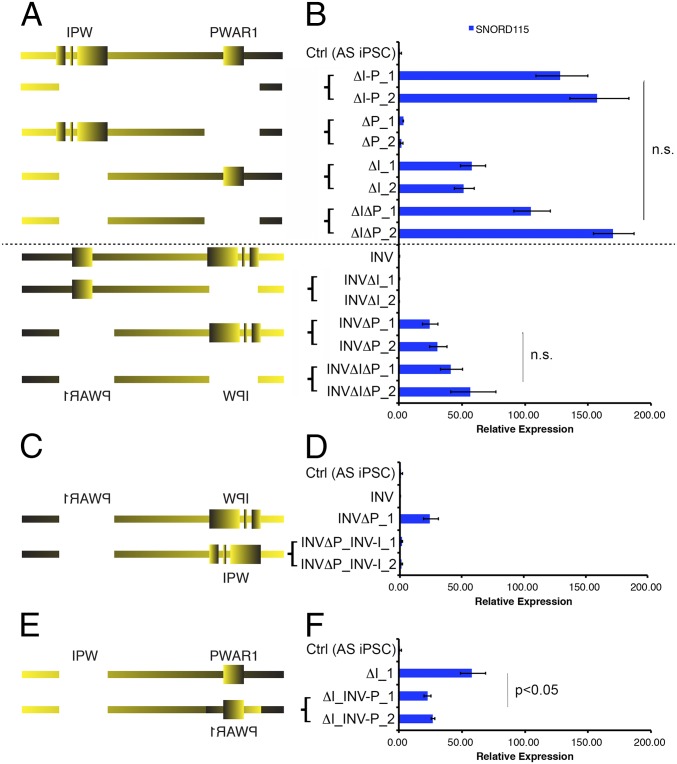
Fig. 2.
IPW and PWAR1 both contribute to boundary function. Diagrams of CRISPR-mediated deletions/inversions generated in unmodified AS iPSCs and INV AS IPSCs (A), INVΔP AS iPSCs (C), and ΔI AS iPSCs (E) are shown. RT-qPCR for SNORD115 in iPSCs with the corresponding deletion/inversion is shown in B, D, and F. ΔI-P_1 and ΔI-P_2 denote two independent clones generated using the same CRISPR constructs. Expression values relative to Ctrl (AS iPSC) are shown. Error bars reflect SEM calculated from, at least, three replicate cultures from each sample. n.s., not significant.

