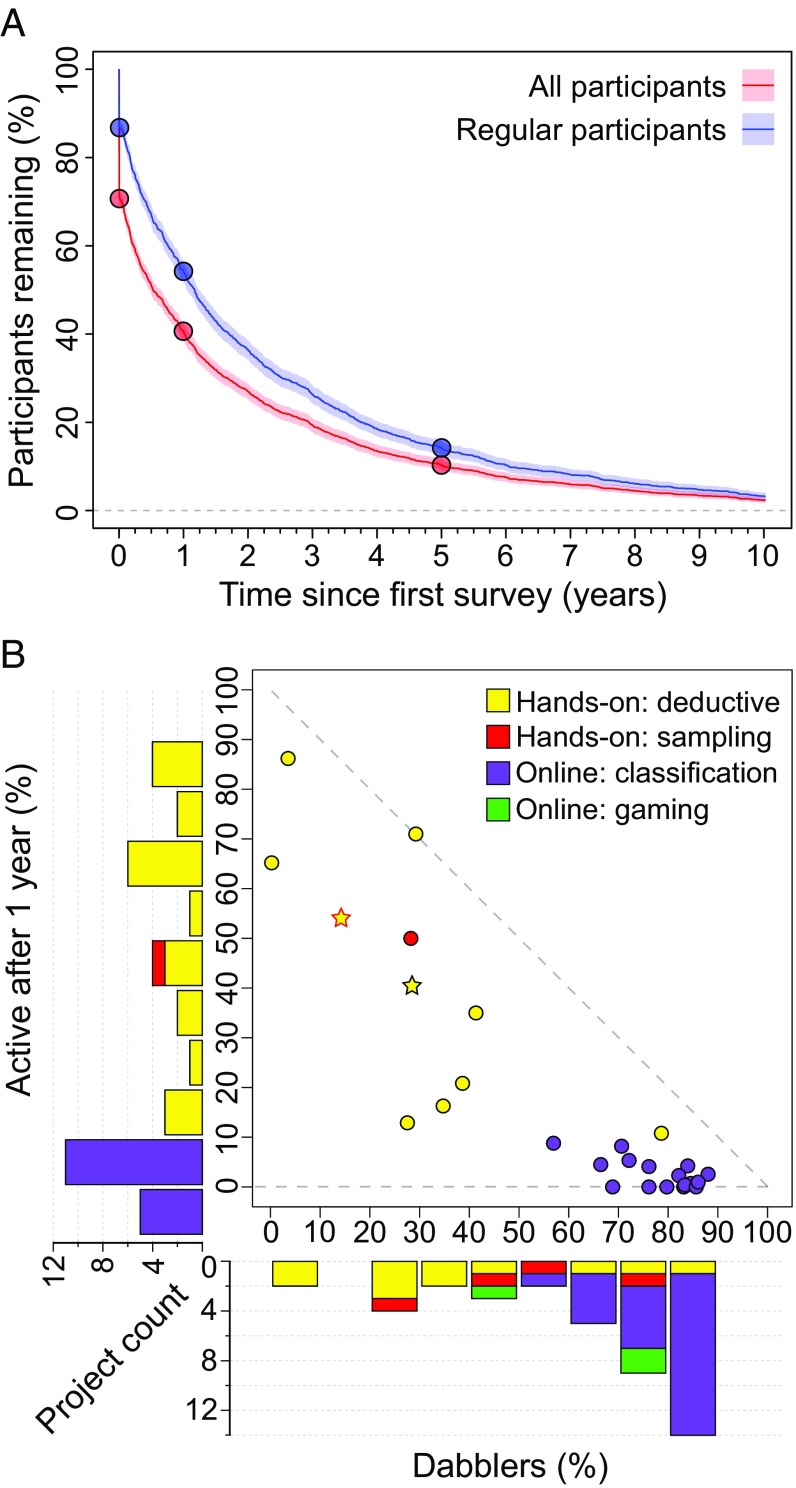
Fig. 1.
The retention landscape in active citizen science. (A) Retention in the COASST program measured as the duration between first and last survey date for all participants (red; n = 2,511) and for regular participants only (i.e., subtracting guests; blue; n = 1,654). Points along the curve (left to right) indicate time points following the first survey, at 1 y, and at 5 y. (B) Results of a meta-analysis of 54 citizen science projects reporting one or both of the percentage of the contributing population interacting for only a single session, observation, task, or survey (i.e., dabblers; n = 41) and the percentage of the contributing population remaining active in the project past 1 y (n = 39). Projects with total turnover at 1 y are in the bar below zero. Histograms are binned counts of all projects for which the relevant data were obtainable; scatterplot points represent projects for which both metrics were available (n = 26). Projects were a priori categorized into four exclusive classes. Stars represent the COASST project (black outline, all participants; red outline, regular participants only). SI Appendix, Table S1 provides a list of projects and sources.

