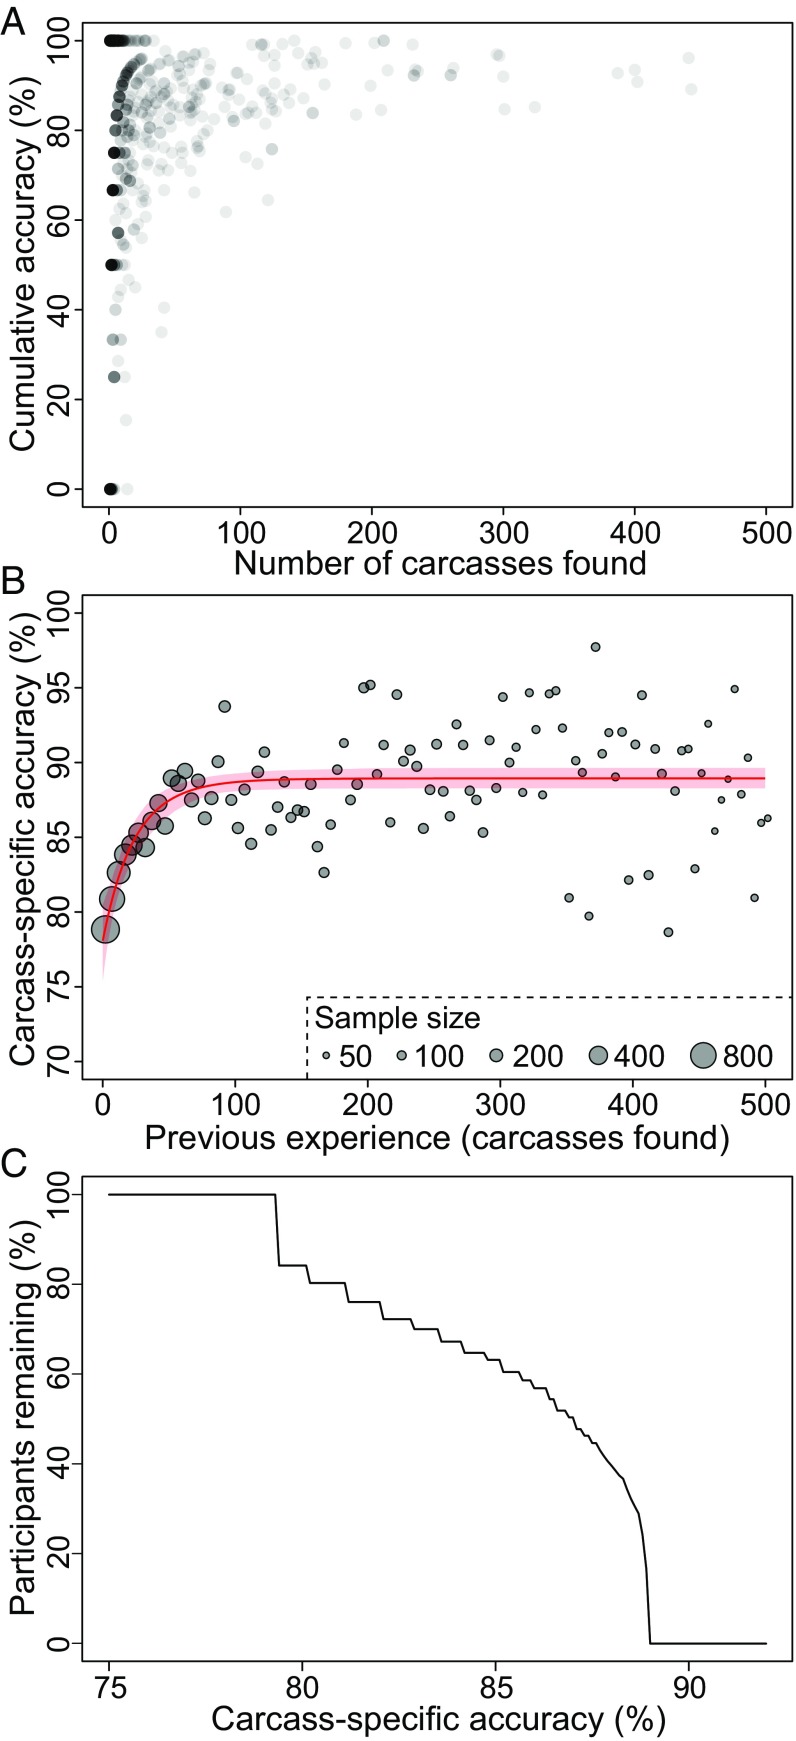
Fig. 2.
(A) Scatterplot of cumulative participant data collection accuracy (i.e., percentage of carcasses identified correctly) of all individuals (n = 774; dots) as a function of the total number of carcasses they found. (B) The population-level learning curve (mean and 95% CI) for taxonomic identification (i.e., the likelihood of correctly identifying a particular carcass, or carcass-specific accuracy) as a function of participant experience (proxied by previous carcasses found by the most experienced team member) modeled as a negative exponential (based on 774 participants, as in A, and 19,831 birds). Dots represent raw data binned (bin size = 5) as a function of experience, with dot size corresponding to the number of carcasses in each bin (i.e., more carcasses were found by less experienced people, on average, than by participants who had found at least 400 carcasses). (C) Trade-off frontier between participant retention and accuracy tuned to Pacific Northwest outer coast sites (average annual carcass encounter rate of 30 birds).

