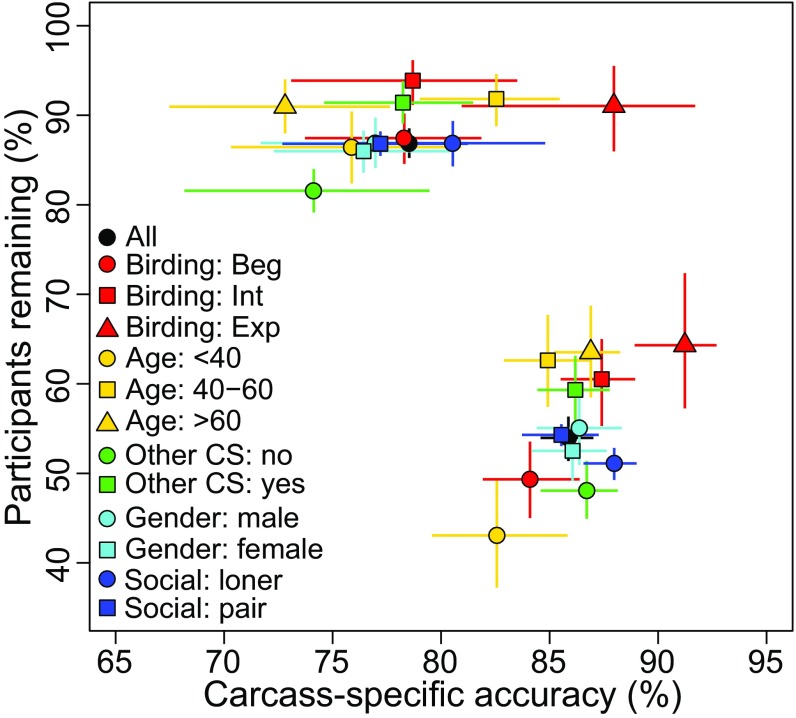
Fig. 3.
Project-level trade-offs extracted from subpopulation-specific learning and retention curves (e.g., SI Appendix, Fig. S4) as the mean and 95% CI of accuracy and retention, respectively, at two points on each curve. Initial (upper cluster) indicates the percentage of the population that perform more than one survey and the accuracy at correct species identification modeled at the first bird encountered; seasoned (lower cluster) indicates the percentage of the population persisting for >1 y and the accuracy at the 30th bird encountered (i.e., a typical year’s accumulation of carcasses in the Pacific Northwest outer coast, assuming monthly surveys of a single beach). Black symbols denote all participants (i.e., project-wide statistics). All other colors denote inclusive classes for which demographic characteristics and interests are known.

