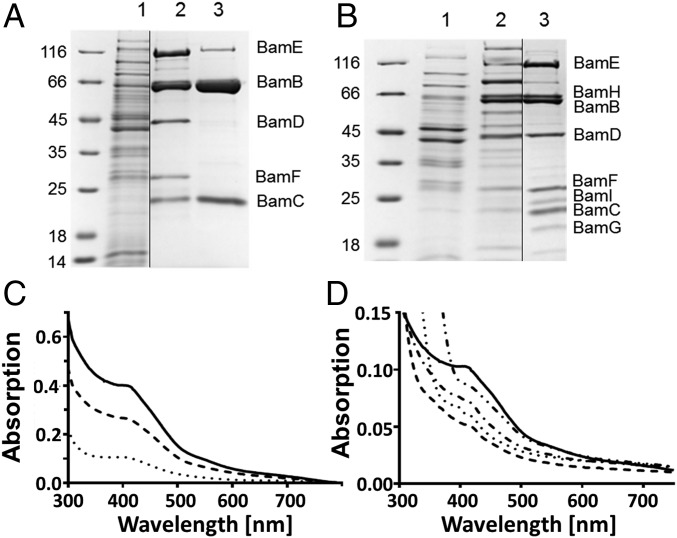
Fig. 2.
Enrichment and UV–visible spectra of different class II BCR (sub)complexes from G. metallireducens. (A) SDS/PAGE analysis of enriched Bam(BStrepC)2 and Bam[(BStrepC)2DEF]2. Lanes: 1, cell extract; 2, fraction eluting at ∼750 kDa; 3, fraction eluting at ∼180 kDa during gel filtration. (B) SDS/PAGE analysis of enriched Bam[(BC)2DEFGHI]2. Lanes: 1, cell extract; 2, after DEAE Sepharose chromatography; 3, after gel filtration. (C) UV–visible spectra normalized to 1 µM BamB concentration of (sub)complexes as isolated: Bam[(BC)2DEFGHI]2 (—), Bam[(BStrepC)2DEF]2 (- - -), and Bam(BStrepC)2 (⋅⋅⋅⋅). (D) UV–visible spectra of 1 µM oxidized Bam[(BC)2DEFGHI]2 (—); reduced with 50 µM NADH (⋅⋅-⋅⋅-); with 50 µM 2-oxoglutarate, 50 μM CoA, 0.2 μmol min−1 KGORTaro, and 0.5 µM Fd (-⋅-⋅); with 50 µM sodium dithionite (⋅⋅⋅⋅); with 50 µM 1,5-dienoyl-CoA (- - -).

