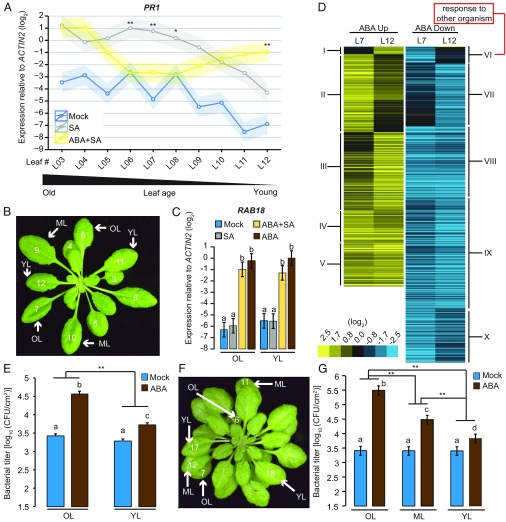
Fig. 1.
Leaf age effects of ABA on SA response and immunity. (A) PR1 expression levels in leaves (from L03 to L12) of 4–5-wk-old A. thaliana Col-0 plants 24 h after spray with 500 µM SA, following 500 µM ABA spray pretreatment for 24 h were determined by quantitative RT-PCR. Data represent means ± SEM (shadows) calculated from three biological replicates by using a mixed linear model. Asterisks indicate significant differences between SA and combined ABA/SA treatments (*P < 0.05 and **P < 0.01, two-tailed Student’s t tests). (B and F) Leaf numbers in 4-wk-old Col-0 (B) and 35S::miR156a (F) plants highlighting old (OL), middle (ML), and young leaves (YL). (C) RAB18 expression levels in old and young leaves of 4–5-wk-old Col-0 plants as in A. Data represent means ± SEM calculated from three biological replicates by using a mixed linear model. Different letters indicate significant differences (adjusted P < 0.05). (D) Heat map showing expression patterns of the genes that show significant expression changes 48 h after ABA spray compared with mock (q < 0.01 and |log2FC| > 1) for up-regulated (yellow; 1,291 genes) or down-regulated genes (blue; 1,712 genes) in L7 or L12 of 4–5-wk-old Col-0 plants. (E and G) Pto hrcC− (OD600 = 0.0002) was infiltrated into old, middle, and young leaves of 4–5-wk-old Col-0 (E) and 35S::miR156a (G) plants 24 h after 500 µM ABA spray or mock. Bacterial growth was measured at 2 days postinoculation. Data represent means ± SEM calculated from at least three independent experiments, each with at least four biological replicates, by using a mixed linear model. Different letters indicate significant differences (adjusted P < 0.005; **P < 0.01, two-tailed Student’s t tests).

