Fig. 7.
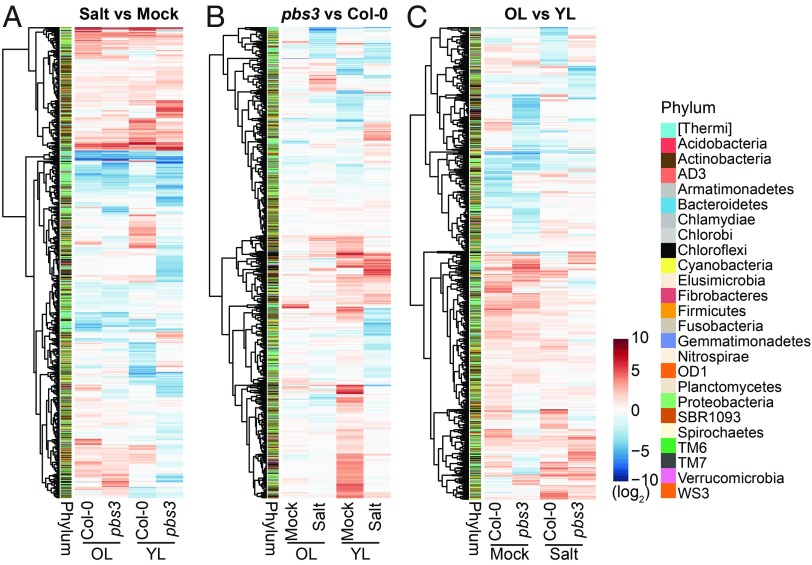
PBS3, salt stress, and leaf age determine relative bacterial abundances. (A) Heat map displaying log2 fold changes of relative abundances in bacterial OTUs under salt stress compared with mock in old leaves (OL) and young leaves (YL) of WT Col-0 and pbs3 plants. (B) Heat map displaying log2 fold changes of relative abundance for bacterial OTUs in old and young leaves of pbs3 compared with Col-0 plants under mock or salt conditions. (C) Heat map displaying log2 fold changes of relative abundance for bacterial OTUs in old leaves compared with young leaves of Col-0 and pbs3 plants under mock or salt conditions. (A–C) Plants were grown in natural Cologne soil treated with water (Mock) or 75 mM NaCl (Salt) for 6 wk. The log2 fold changes were subjected to hierarchical clustering. The phylum to which each OTU belongs is indicated by the colored bar.

